CAVITATION AND BUBBLE DYNAMICS
by
Christopher Earls Brennen © Oxford University Press 1995
CHAPTER 6.
HOMOGENEOUS BUBBLY FLOWS
6.1 INTRODUCTION
When the concentration of bubbles in a flow exceeds some
small value the bubbles will begin to have a substantial effect on
the fluid dynamics of the suspending liquid. Analyses of the dynamics
of this multiphase mixture then become significantly more complicated
and important new phenomena may be manifest. In this chapter we
discuss some of the analyses and phenomena that may occur in
bubbly multiphase flow.
In the larger context of practical multiphase
(or multicomponent) flows
one finds a wide range of homogeneities, from those consisting of one
phase (or component) that is very finely dispersed
within the other phase (or component) to those that consist of two
separate streams of the two phases (or components). In between
are topologies that are less readily defined.
The two asymptotic states are conveniently referred to
as homogeneous and
separated flow.
One of the consequences of the topology
is the extent to which relative motion between the
phases can occur. It is clear that two different streams can
readily travel at different velocities, and indeed such relative
motion is an implicit part of the study of separated flows. On
the other hand, it is clear from the results of
Section 5.11
that any two phases could, in theory, be sufficiently well mixed
and the disperse particle size sufficiently small so as to
eliminate any significant relative motion.
Thus the asymptotic limit of truly homogeneous flow precludes
relative motion.
Indeed, the term homogeneous flow is sometimes
used to denote a flow with negligible relative motion.
Many bubbly flows come close to this limit and can, to a first
approximation, be considered to be homogeneous. In the present chapter
we shall consider some of the properties of homogeneous
bubbly flows.
In the absence of relative
motion the governing mass and momentum conservation equations reduce
to a form similar to those for
single-phase flow. The effective mixture density,
ρ, is defined by
 | ......(6.1)
|
where αN is the volume fraction of each of the
N components or
phases whose individual densities are ρN. Then the
continuity and
momentum equations for the homogeneous mixture are
 | ......(6.2)
|
 | ......(6.3)
|
in the absence of viscous effects. As in single-phase flows the
existence of a barotropic relation,
p=f(ρ), would
complete the system of equations. In some multiphase flows it
is possible to establish such a barotropic relation, and this
allows one to anticipate (with, perhaps, some minor
modification) that the entire spectrum of phenomena observed in
single-phase gas dynamics can be expected in such a two-phase flow.
In this chapter we shall not dwell
on this established body of literature. Rather, we shall confine
attention to the identification of a barotropic relation (if any)
and focus on some flows in which there are major departures from
the conventional gas dynamic behavior.
From a thermodynamic point of view the existence of a barotropic
relation, p=f(ρ), and its associated sonic speed,
 | ......(6.4)
|
implies that some thermodynamic property is considered to be held constant.
In single-phase gas dynamics this quantity is usually
the entropy and occasionally the temperature. In multiphase flows the
alternatives are neither simple nor obvious. In single-phase
gas dynamics it is commonly assumed that the gas is in
thermodynamic equilibrium at all times.
In multiphase flows it
is usually the case that the two phases are not in thermodynamic
equilibrium with each other. These are some of the questions
one must address in considering an appropriate homogeneous flow
model for a multiphase flow. We begin in the next section by
considering the sonic speed of a two-phase or two-component
mixture.
6.2 SONIC SPEED
Consider an infinitesmal volume of a mixture consisting of a
disperse phase denoted by the subscript A and a continuous phase
denoted by the subscript B. For convenience assume the initial
volume to be unity. Denote the initial densities
by ρA and ρB and the initial pressure in the
continuous phase by pB. Surface tension, S,
can be included by denoting the radius of the disperse phase particles
by R. Then the initial pressure in the disperse phase is
pA=pB+2S/R.
Now consider that the pressure, pA, is changed to
pA+δpA
where the difference δpA is infinitesmal.
Any dynamics associated
with the resulting fluid motions will be ignored for the
moment. It is assumed that a new equilibrium state is
achieved and that, in the process, a mass, δm,
is transferred from the continuous to the disperse phase. It
follows that the new disperse and continuous phase masses
are ρAαA+δm and
ρBαB-δm
respectively where, of course,
αB=1-αA. Hence the
new disperse and continuous phase volumes are respectively
 | ......(6.5)
|
and
 | ......(6.6)
|
where the thermodynamic constraints QA and QB are, as yet,
unspecified. Adding these together and subtracting unity,
one obtains the change in total volume, δV, and hence
the sonic velocity, c, as
 | ......(6.7)
|
 | ......(6.8)
|
where, as defined in Equation 6.1,
ρ=ρAαA+ρBαB.
If one assumes
that no disperse particles are created or destroyed, then the ratio
δpA/δpB may be determined by evaluating the new
disperse particle size R+δR commensurate with the
new disperse phase volume and using the relation
δpA=δpB-2S δR/R2:
 | ......(6.9)
|
Substituting this into Equation 6.8 and using, for
convenience, the notation
 | ......(6.10)
|
the result can be written as
 | ......(6.11)
|
This is incomplete in several respects. First, appropriate
thermodynamic constraints QA and QB must be identified.
Second, some additional constraint is necessary to establish
the relation δm/δpB. But before
entering into a discussion of appropriate practical choices
for these constraints (see Section 6.3) several simpler
versions of Equation 6.11 should be discussed.
We first observe that in the absence of any exchange of
mass between the components the result reduces to
 | ......(6.12)
|
In most practical cases one can neglect the surface tension
effect since
S « ρAcA2R and
Equation 6.12 becomes
 | ......(6.13)
|
In other words, the acoustic impedance 1/ρc2 for
the mixture is simply given by the average of the acoustic impedance of the
components weighted according to their volume fractions.
Perhaps the most dramatic effects occur when one of the
components is a gas (subscript G), which is much more
compressible than the other component (a liquid or solid,
subscript L). In the absence of surface tension
(p=pG=pL),
according to Equation 6.13, it matters not whether the gas is the
continuous or the disperse phase. Denoting
αG by α for convenience and
assuming the gas is perfect and behaves polytropically so that
ρGk is proportional to p,
Equation 6.13 may be written as
 | ......(6.14)
|
This is the familiar form for the sonic speed in a two-component
gas/liquid or gas/solid flow. In many
applications p/ρLcL2 « 1 and
hence this expression may be further simplified to
 | ......(6.15)
|
Note however, that this approximation will not hold
for small values of the gas volume fraction α.
Equation 6.14 and its special properties were first identified
by Minnaert (1933). It clearly exhibits one of the most
remarkable features of the sonic velocity of gas/liquid or gas/solid
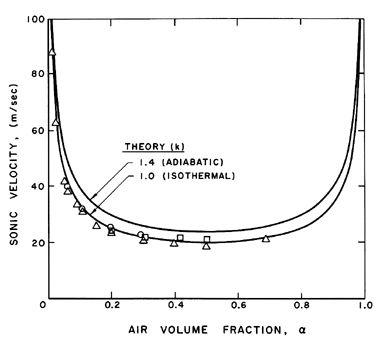
mixtures. The sonic velocity of the
mixture can be very much smaller than
that of either of its constituents. This is illustrated in Figure 6.1
where the speed of sound, c, in an air/water bubbly mixture is plotted
against the air volume fraction, α. Results are shown for both
isothermal (k=1) and adiabatic (k=1.4) bubble behavior using Equation
6.14 or 6.15,
the curves for these two equations being
indistinguishable on the scale of the figure. Note that sonic velocities as
low as 20m/s occur.
Figure 6.1
The sonic velocity in a bubbly air/water
mixture at atmospheric pressure
for k=1.0 and 1.4. Experimental data presented is
from Karplus (1958) and Gouse and Brown (1964) for frequencies of 1kHz
(circles), 0.5kHz (squares), and extrapolated to zero
frequency(triangles).
Also shown in Figure 6.1 is experimental data of Karplus (1958) and
Gouse and Brown (1964). We shall see later
(Section 6.8) that the
dynamics of the bubble volume change cause the sound speed to be
a function of the frequency. Data for sound frequencies of 1.0kHz and
0.5kHz are shown, as well as data extrapolated to zero frequency. The
last should be compared with the analytical results presented here
since the analysis of this section neglects bubble dynamic effects.
Note that the data corresponds to the isothermal theory, indicating
that the heat transfer between the bubbles and the liquid is sufficient
to maintain the air in the bubbles at roughly constant temperature.
Further discussion of the acoustic characteristics of dilute bubbly
mixtures is delayed until Section 6.8.
6.3 SONIC SPEED WITH CHANGE OF PHASE
Turning now to the behavior of a two-phase rather than
two-component mixture, it is necessary not only to consider the additional
thermodynamic constraint required to establish the mass exchange,
δm,
but also to reconsider the two thermodynamic constraints,
QA and QB,
which were implicit in the two-component analysis. These latter
constraints were implicit in the choice of the polytropic index, k,
for the gas and the choice of the sonic speed, cL, for the
liquid. Note that a nonisentropic choice for k
(for example, k=1)
implies that heat is exchanged between the components, and yet this
heat transfer process was not explicitly considered, nor was an
overall thermodynamic contraint such as might be placed on the
global change in entropy.
We shall see that the two-phase case requires more intimate knowledge
of these factors because the results are more sensitive to the
thermodynamic constraints. In an ideal, infinitely homogenized
mixture of vapor and liquid the phases would everywhere be in such
close proximity to each other that heat transfer between the phases would
occur instantaneously. The entire mixture of vapor and liquid would
then always be in thermodynamic equilibrium. Indeed, one model of
the response of the mixture, called the homogeneous equilibrium
model,
assumes this to be the case. In practice, however, one seeks results
for bubbly flows and mist flows in which heat transfer between
the phases does not occur so readily. A second common model assumes
zero heat transfer between the phases and is known as the
homogeneous frozen model.
In many circumstances the actual
response lies somewhere between these extremes. A limited amount of
heat transfer occurs between those portions of each phase that are
close to the interface. In order to incorporate this in the analysis,
we adopt an approach that includes the homogeneous equilibrium and
homogeneous frozen responses as special cases but that requires a
minor adjustment to the analysis of the last section in order to reflect
the degree of thermal exchange between the phases. As in the last
section the total mass of the phases A and B after application of
the incremental pressure, δp, are
ρAαA+δm
and ρBαB-δm, respectively. We
now define the fractions of each phase, εA and
εB
which, because of their proximity to the interface, exchange heat
and therefore approach thermodynamic equilibrium with each other.
The other fractions (1-εA) and
(1-εB) are
assumed to be effectively insulated so that they behave isentropically. This
is, of course, a crude simplification of the actual circumstances, but
it permits qualitative assessment of practical flows.
It follows that the volumes of the four fractions following the
incremental change in pressure, δp, are
 | ......(6.16)
|
where the subscripts S and E refer to isentropic and phase
equilibrium
derivatives, respectively. Then the change in total volume leads to the
following modified form for Equation 6.11 in the absence of surface
tension:
 | ......(6.17)
|
The exchange of mass, δm, is now determined by imposing the constraint
that the entropy of the whole be unchanged by the perturbation. The
entropy prior to δp is
 | ......(6.18)
|
where sA and sB are the specific
entropies of the two phases.
Following the application of δp, the entropy is
 | ......(6.19)
|
Equating 6.18 and 6.19
and writing the result in terms of the specific
enthalpies hA and hB rather than
sA and sB, one obtains
 | ......(6.20)
|
Note that if the communicating fractions εA and
εB
were both zero, this would imply no exchange of mass. Thus
εA=εB=0
corresponds to the homogeneous frozen model (in which δm=0)
whereas εA=εB=1 clearly yields the
homogeneous equilibrium model.
Substituting Equation 6.20 into Equation 6.17
and rearranging the result, one can write
 | ......(6.21)
|
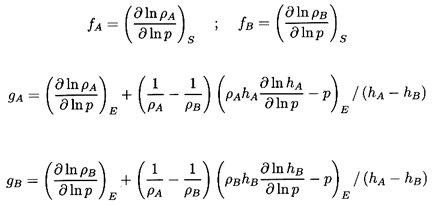
where the quantities fA, fB,
gA, and
gB are purely thermodynamic
properties of the two phases defined by
 | ......(6.22)
|
The sensitivity of the results to the, as yet, unspecified quantitives
εA and εB does not
emerge until
one substitutes vapor and liquid for the phases A and B
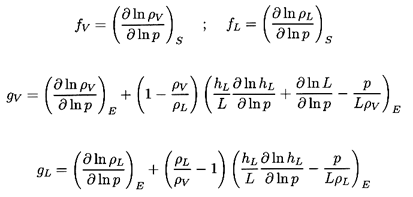
(A=V, B=L, and αA=α,
αB=1-α
for simplicity). The functions fL, fB,
gL, and gV then become
 | ......(6.23)
|
where L=hV -hL is the latent heat.
It is normally adequate
to approximate fV and fL by the reciprocal of the
ratio of specific heats for the gas and zero respectively.
Thus fV is of order
unity and fL is very small. Furthermore gL and
gV can
readily be calculated for any fluid as functions of pressure or
temperature. Some particular values are shown in Figure 6.2.
Note that
gV is close to unity for most fluids except in the neighborhood
of the critical point. On the other hand, gL can be a large
number that varies considerably with pressure. To a first approximation,
gL
is given by g*(pC/p)η where
pC is the
critical pressure and, as indicated in
Figure 6.2, g* and η
are respectively 1.67 and 0.73 for water. Thus, in summary,
fL≈0, fV and gV are of order
unity, and
gL varies significantly with pressure and may be large.
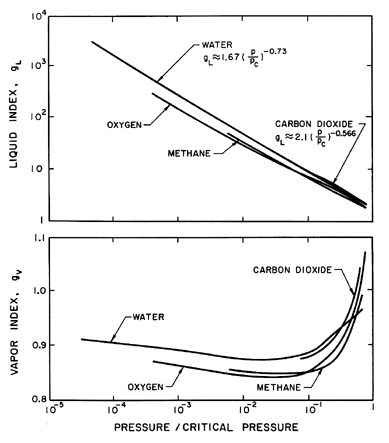
| Figure 6.2
Typical values of the liquid index, gL, and
the vapor index, gV, for various fluids.
|
With these magnitudes in mind, we now examine the sensitivity of
1/ρc2 to the interacting fluid fractions
εL and εV:
 | ......(6.24)
|
Using gL=g*(pC/p)η
this is written for future convenience in the form:
 | ......(6.25)
|
where
kV=(1-εV)fV+εVgV
and kL=εLg*(pC)η.
Note first that the result is rather insensitive to
εV since fV and
gV are both
of order unity.
On the other hand 1/ρc2 is sensitive
to the interacting liquid fraction εL though
this sensitivity
disappears as α approaches 1, in other words for mist flow.
Thus the choice of εL is most important at low
vapor volume fractions (for
bubbly flows). In such cases, one possible qualitative estimate is that
the interacting liquid fraction, εL, should be of the same order
as the gas volume fraction, α. In
Section 6.6 we will
examine the effect of the choice of εL and
εV
on a typical vapor/liquid flow and compare the model with experimental
measurements.
6.4 BAROTROPIC RELATIONS
Conceptually, the expressions for the sonic velocity, Equations
6.13, 6.14, 6.15, or 6.24, need
only be integrated (after substituting c2=dp/dρ) in
order to obtain the barotropic relation, p(ρ), for the mixture.
In practice
this is algebraically complicated except for some of the simpler forms for
c2.
Consider first the case of the two-component mixture in the absence of
mass exchange or surface tension as given by
Equation 6.14. It will initially
be assumed that the gas volume fraction is not too small so that Equation
6.15 can be used; we will return later to the case of small gas
volume fraction. It is also assumed that the liquid or solid density,
ρL, is constant and that p is proportional
to ρGk. Furthermore
it is convenient, as in gas dynamics, to choose reservoir
conditions,
p=po, α=αo,
ρG=ρGo
to establish the integration constants. Then it follows from the integration
of Equation 6.15 that
 | ......(6.26)
|
and that
 | ......(6.27)
|
where
ρo=ρL(1-αo)+ρGoαo.
It also follows that, written in terms of α,
 | ......(6.28)
|
As will be discussed later, Tangren, Dodge, and Seifert (1949) first made use of
a more limited form of the barotropic relation
of Equation 6.27 to evaluate the
one-dimensional flow of gas/liquid mixtures in ducts and nozzles.
In the case of very small gas volume fractions, α,
it may be necessary to
include the liquid compressibility
term, 1-α/ρLcL2, in
Equation 6.14. Exact
integration then becomes very
complicated. However, it is sufficiently accurate at small
gas volume fractions to approximate the mixture density ρ by
ρL(1-α), and then
integration (assuming
ρLcL2 = constant)
yields
 | ......(6.29)
|
and the sonic velocity can be expressed in terms of
p/po alone
by using Equation 6.29 and noting that
 | ......(6.30)
|
Implicit within Equation 6.29 is the barotropic
relation, p(α), analogous to Equation 6.27. Note that
Equation 6.29 reduces to Equation 6.27
when po/ρLcL2 is set
equal to zero. Indeed, it is clear from Equation 6.29
that the liquid compressibility
has a negligible effect only if
αo » po/ρLcL2.
This parameter,
po/ρLcL2,
is usually quite small. For example, for
saturated water at 5×10⁷kg/m sec2
(500psi) the
value of po/ρLcL2
is approximately 0.03. Nevertheless, there are
many practical problems in which one is concerned with the discharge
of a predominantly liquid medium from high pressure containers, and under
these circumstances it can be important to include the liquid compressibility
effects.
Now turning attention to a two-phase rather than two-component homogeneous
mixture, the particular form of the sonic velocity given in Equation
6.25 may be integrated to yield the implicit barotropic relation
 | ......(6.31)
|
in which the approximation
ρ≈ρL(1-α) has been used.
As before, c2 may be expressed in terms of
p/po alone by noting that
 | ......(6.32)
|
Finally, we note that close to α=1 the Equations 6.31 and
6.32 may fail because
the approximation ρ≈ρL(1-α)
is not sufficiently accurate.
6.5 NOZZLE FLOWS
The barotropic relations of the last section can be used in conjunction
with the steady, one-dimensional continuity and frictionless momentum
equations,
 | ......(6.33)
|
and
 | ......(6.34)
|
to synthesize homogeneous multiphase flow in ducts and nozzles. The
predicted phenomena are qualitatively similar to those in one-dimensional
gas dynamics. The results for isothermal, two-component flow were first
detailed by Tangren, Dodge, and Seifert (1949); more general results for
any polytropic index are given in this section.
Using the barotropic relation given by Equation 6.27 and
Equation 6.26 for the mixture density, ρ, to eliminate p
and ρ from the momentum
Equation 6.34, one obtains
 | ......(6.35)
|
which upon integration and imposition of the reservoir condition,
uo=0, yields
 | ......(6.36)
|
Given the reservoir conditions po and
αo
as well as the polytropic
index k and the liquid density (assumed constant), this relates the
velocity, u, at any position in the duct to the gas volume fraction,
α, at that
location. The pressure, p, density, ρ, and volume
fraction, α,
are related by Equations 6.26 and 6.27.
The continuity equation,
 | ......(6.37)
|
completes the system of equations by permitting identification of the
location where p, ρ, u, and α occur
from knowledge of the cross-sectional area, A.
As in gas dynamics the conditions at a throat
play a particular role in
determining both the overall flow and the mass flow rate. This results
from the observation that Equations 6.33 and 6.31 may be
combined to obtain
 | ......(6.38)
|
where c2=dp/dρ. Hence at a throat where dA/ds=0,
either dp/ds=0, which is true when the flow is entirely
subsonic and unchoked; or u=c, which is true when the flow is
choked. Denoting choked conditions at a throat by the subscript *,
it follows by equating the right-hand sides of Equations 6.28
and 6.36 that the gas volume fraction at the throat,
α*,
must be given when k≠1 by the solution of
 | ......(6.39)
|
or, in the case of isothermal gas behavior (k=1), by the solution of
 | ......(6.40)
|
Thus the throat gas volume fraction,
α*, under choked flow
conditions is a function only of the reservoir gas volume fraction,
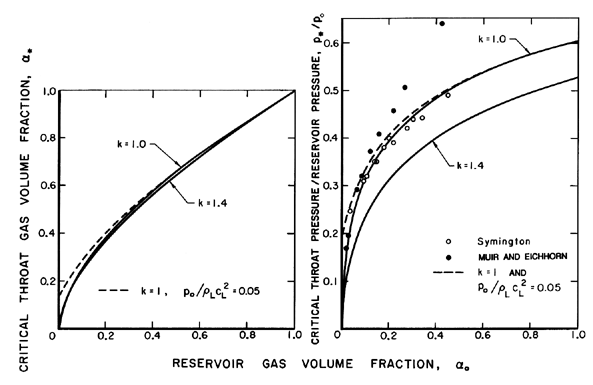
αo, and the polytropic index. Solutions of
Equations 6.39 and 6.40
for two typical cases, k=1.4 and k=1.0, are shown in Figure 6.3.
The corresponding ratio of the choked throat pressure, p*,
to the reservior pressure, po, follows immediately from
Equation 6.27 given α=α* and is also shown in
Figure 6.3. Finally,
the choked mass flow rate,
 C, follows as
ρ*A*c*
where A* is the cross-sectional area of the throat and
 | ......(6.41)
|
This dimensionless choked mass flow rate
is exhibited in
Figure 6.4 for k=1.4 and k=1.
Figure 6.3
Critical or choked flow throat characteristics
for the flow of a two-component gas/liquid mixture through a nozzle. On
the left is the throat gas volume fraction as a function of the
reservoir gas volume fraction,
αo, for gas polytropic
indices of
k=1.0 and 1.4 and an incompressible liquid (solid lines)
and for k=1
and a compressible liquid with
po/ρLc2L=0.05 (dashed line). On
the right are the corresponding ratios of critical throat pressure to
reservoir pressure. Also shown is the experimental data of Symington
(1978) and Muir and Eichhorn (1963).
Data from the experiments of Symington (1978) and Muir and
Eichhorn (1963) are included in
Figures 6.3 and 6.4. Symington's data
on the critical pressure ratio
(Figure 6.3) is in good agreement with
the isothermal (k=1) analysis indicating that, at least in his
experiments, the heat transfer between the bubbles and the liquid is
large enough to maintain constant gas temperature in the
bubbles. On the other hand, the experiments of Muir and Eichhorn yielded
larger critical pressure ratios and flow rates than the
isothermal theory. However, Muir and Eichhorn measured significant slip
between the bubbles and the liquid (strictly speaking the abscissa for
their data in Figures 6.3
and 6.4 should be the upstream volumetric
quality rather than the void fraction),
and the discrepancy could be due
to the errors introduced into the present analysis by the neglect of
possible relative motion (see also van Wijngaarden 1972).
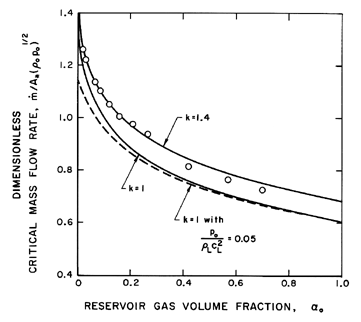
| Figure 6.4
Dimensionless critical mass flow rate,
 /A*(poρo)½,
as a function of αo for choked flow
of a gas/liquid flow through a nozzle. Solid lines are incompressible
liquid results for polytropic indices of 1.4 and 1.0. Dashed line shows
effect of liquid compressibility for
po/ρLcL2=0.05. The
experimental data (circles) are from Muir and Eichhorn (1963). /A*(poρo)½,
as a function of αo for choked flow
of a gas/liquid flow through a nozzle. Solid lines are incompressible
liquid results for polytropic indices of 1.4 and 1.0. Dashed line shows
effect of liquid compressibility for
po/ρLcL2=0.05. The
experimental data (circles) are from Muir and Eichhorn (1963).
|
Finally, the pressure, volume fraction, and velocity elsewhere in the
duct or nozzle can be related to the throat conditions and the ratio
of the area, A, to the throat area, A*.
These relations,
which are presented in
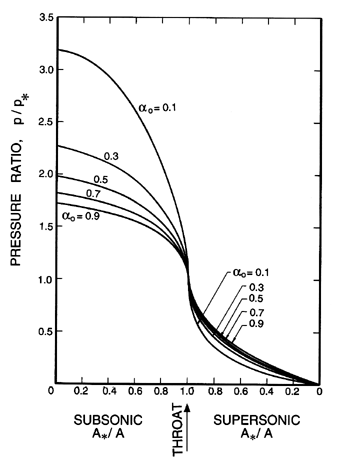
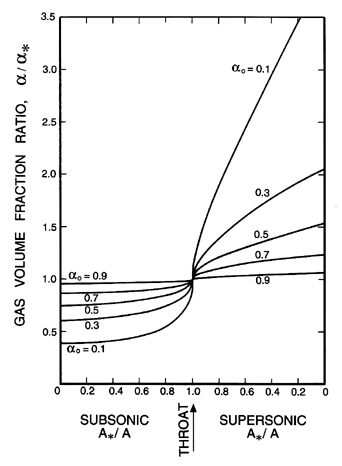
Figures 6.5, 6.6, and 6.7 for the case k=1 and
various reservoir volume fractions, αo, are most
readily obtained in the following manner. Given αo
and k, p*/po and
α* follow from Figure 6.3. Then
for p/po or p/p*,
α and u follow from Equations 6.27 and 6.36
and the corresponding
A/A* follows by using Equation 6.37. The resulting charts,
Figures 6.5, 6.6, and 6.7, can then be used in the same
way as the corresponding graphs in
gas dynamics.
| | 
|
| Figure 6.5
Ratio of the pressure, p, to the throat pressure, p*,
for two-component flow in a duct with isothermal gas behavior.
| | Figure 6.6
Ratio of the void fraction, α, to the
throat void fraction, α*, for two-component flow in
a duct with isothermal gas behavior.
|
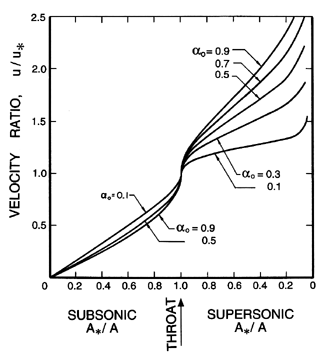
| Figure 6.7
Ratio of the velocity, u, to the throat velocity,
u*, for two-component flow in a duct with isothermal
gas behavior.
|
If the gas volume fraction, αo, is sufficiently
small so that it is comparable with
po/ρLcL2, then
the barotropic Equation 6.29
should be used instead of Equation 6.27. In cases like this
in which it is sufficient to assume that
ρ≈ρL(1-α),
integration of the momentum Equation 6.34 is most readily
accomplished by writing it in the form
 | ......(6.42)
|
Then substitution of Equation 6.29 for α/(1-α)
leads in the present case to
 | ......(6.43)
|
The throat pressure, p* (or rather
p*/po),
is then obtained by equating the velocity u for p=p*
from Equation 6.43
to the sonic velocity c at p=p* obtained from
Equation 6.30. The resulting relation, though algebraically complicated, is
readily solved for the critical pressure ratio,
p*/po,
and the throat gas volume fraction,
α*, follows from Equation 6.29.
Values of p*/po for k=1 and k=1.4
are shown in Figure 6.3 for the particular value of
po/ρLcL2 of 0.05.
Note that the
most significant deviations caused by
liquid compressibility occur for gas volume fractions of the order
of 0.05 or less. The corresponding dimensionless critical mass flow
rates,
 C/A*(ρopo)½,
are also readily calculated from
 | ......(6.44)
|
and sample results are shown in Figure 6.4.
6.6 VAPOR/LIQUID NOZZLE FLOW
A barotropic relation, Equation 6.31, was constructed in
Section 6.4
for the case of two-phase flow and, in particular, for vapor/liquid
flow. This may be used to synthesize nozzle flows in a manner similar
to the two-component analysis of the last section.
Since the approximation
ρ≈ρL(1-α) was used in
deriving both Equation 6.31 and Equation 6.42,
we may eliminate
α/(1-α) from these equations to obtain
the velocity, u, in terms of p/po:
 | ......(6.45)
|
To find the relation for the critical pressure ratio,
p*/po,
the velocity, u, must equated with the sonic velocity, c,
as given by Equation 6.32:
 | ......(6.46)
|
Though algebraically complicated, the equation that results when the
right-hand sides of
Equations 6.45 and 6.46 are
equated can readily be solved numerically
to obtain the critical pressure ratio,
p*/po, for a given fluid and given values of
αo, the
reservoir pressure and the interacting
fluid fractions εL and
εV (see Section 6.3).
Having obtained the critical pressure ratio, the
critical vapor volume fraction,
α*, follows from Equation 6.31 and the
throat velocity, c*, from Equation 6.46.
Then the dimensionless choked mass
flow rate follows from the same relation
as given in Equation 6.44.
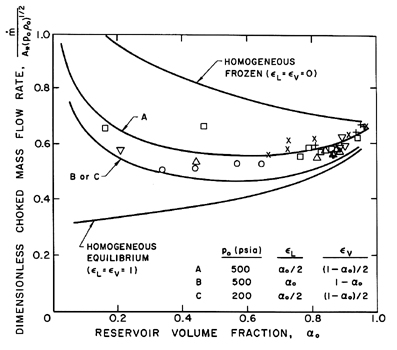
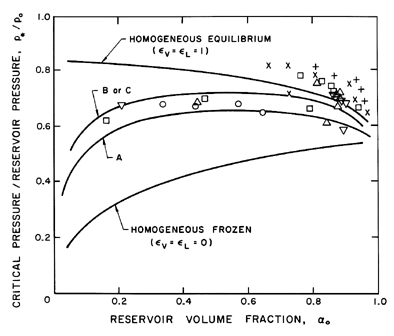
Sample results for the choked mass flow rate and the critical pressure ratio
are shown in Figures 6.8 and 6.9. Results for both homogeneous frozen
flow (εL=εV=0)
and for homogeneous equilibrium flow
(εL=εV=1) are presented;
note that these results are independent of the fluid or the reservoir
pressure, po. Also shown in the figures are the theoretical results
for various partially frozen cases for water
at two different reservoir pressures.
The interacting fluid fractions were chosen with the comment
at the end of Section 6.3 in mind. Since
εL is most
important at low vapor volume fractions (i.e., for bubbly flows), it is
reasonable to estimate that the interacting volume of liquid surrounding
each bubble will be of the same order as the bubble volume. Hence
εL=αo or
αo/2
are appropriate choices. Similarly,
εV is most important at high vapor volume fractions
(i.e., droplet
flows), and it is reasonable to estimate that the interacting volume of
vapor surrounding each droplet would be of the same order as the
droplet volume; hence
εV=(1-αo) or
(1-αo)/2 are appropriate choices.
|
Figure 6.8
The dimensionless choked mass flow rate,
 /A*(poρo)½,
plotted against the reservoir vapor
volume fraction, αo, for water/steam mixtures.
The data shown is from the experiments
of Maneely (1962) and Neusen (1962) for 100→200 psia
(plus signs), 200→300 psia (×),
300→400 psia (squares), 400→500 psia (triangles),
500→600 psia (upsidedown triangles) and
>600 psia (asterisks).
The theoretical lines use
g*=1.67, η=0.73, gV=0.91, and
fV=0.769 for water.
Figures 6.8 and 6.9 also
include data obtained for water by Maneely (1962)
and Neusen (1962) for various reservoir pressures and volume fractions.
Note that the measured choked mass flow rates are bracketed by the
homogeneous frozen and equilibrium curves and that the appropriately
chosen partially frozen analysis is in close agreement with the
experiments, despite the neglect (in the present model) of possible slip
between the phases. The critical pressure ratio data is also in good
agreement with the partially frozen analysis except for some discrepancy
at the higher reservoir volume fractions.
Figure 6.9
The ratio of critical pressure, p*, to
reservoir pressure, po, plotted against the reservoir vapor volume
fraction, αo, for water/steam mixtures. The data and the
partially frozen model
results are for the same conditions as in Figure 6.8.
It should be noted that the analytical approach described above
is much simpler to implement than the numerical solution of the basic
equations suggested by Henry and Fauske (1971). The latter does, however,
have the advantage that slip between the phases was incorporated into
the model.
Finally, information on the pressure, volume fraction, and velocity elsewhere
in the duct (p/p*, u/u*, and
α/α*)
as a function
of the area ratio A/A* follows from a procedure similar to that
used for the noncondensable case in
Section 6.5. Typical results for
water with a reservoir pressure, po, of 500psia
and using the partially frozen analysis with
εV=αo/2 and
εL=(1-αo)/2
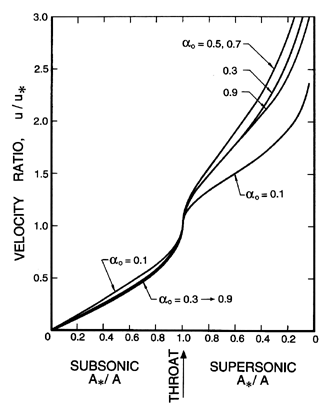
are presented in Figures 6.10, 6.11, and 6.12.
In comparing these results with those for the two-component mixture
(Figures 6.5, 6.6, and 6.7) we observe that
the pressure ratios
are substantially smaller and do not vary monotonically with
αo. The
volume fraction changes are smaller, while the velocity gradients are
larger.
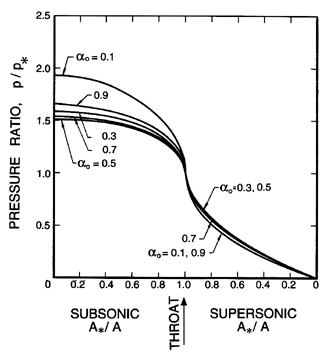 | Figure 6.10
Ratio of the pressure, p, to the critical
pressure, p*, as a function of the area ratio,
A*/A, for the case of
water with g*=1.67, η=0.73,
gV=0.91,
and fV=0.769.
|
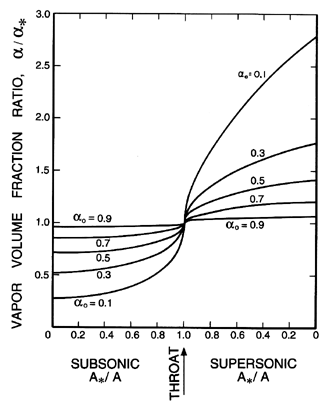
| | 
|
| Figure 6.11
Ratio of the vapor volume fraction, α,
to the critical vapor volume fraction, α*,
as a function of area ratio for the same case as Figure 6.10.
|
| Figure 6.12
Ratio of the velocity, u, to the critical
velocity, u*, as a function of the area ratio for the
same case as Figure 6.10.
|
6.7 FLOWS WITH BUBBLE DYNAMICS
Up to this point the analyses have been predicated on the existence
of an effective barotropic relation for the homogeneous mixture. Indeed,
the construction of the sonic speed in
Sections 6.2 and 6.3 assumes that
all the phases are in dynamic equilibrium at all times. For example,
in the case of bubbles in liquids, it is assumed that the response of the
bubbles to the change in pressure, δp, is an essentially
instantaneous change in their volume. In practice this would only be
the case if the typical frequencies experienced by the bubbles in the flow
are very much smaller than the natural frequencies of the bubbles themselves
(see Section 4.2).
Under these circumstances the bubbles would behave
quasistatically and the mixture would be barotropic.
In this section we shall examine some flows in which this criterion
is not met. Then the dynamics of individual bubbles as manifest by the
Rayleigh-Plesset Equation 2.12 should be incorporated into the
solutions of the problem. The mixture will no longer behave barotropically.
Viewing it from another perspective, we note that analyses of cavitating flows
often consist of using a single-phase liquid pressure distribution as
input to the Rayleigh-Plesset equation. The result is the history of
the size of individual cavitating bubbles as they progress along a
streamline in the otherwise purely liquid flow. Such an approach entirely
neglects the interactive effects that the cavitating bubbles have on
themselves and on the pressure and velocity of the liquid flow. The
analysis that follows incorporates these interactions using the
equations for nonbarotropic homogeneous flow.
It is assumed that the ratio of liquid to vapor density is sufficiently
large so that the volume of liquid evaporated or condensed is
negligible. It is also assumed that bubbles are neither created or
destroyed. Then the appropriate continuity equation is
 | ......(6.47)
|
where η is the population or number of bubbles per unit volume of
liquid and τ(xi ,t) is the volume of individual bubbles.
The above form of the continuity equation assumes that η is
uniform; such would be the case if the flow originated from a
uniform stream of uniform population and if there were no relative motion
between the bubbles and the liquid.
Note also that
α=ητ/(1+ητ) and the mixture density,
ρ≈ρL(1-α)=ρL/(1+ητ).
This last relation can be used to write the
momentum Equation 6.3 in terms of τ rather than ρ:
 | ......(6.48)
|
The hydrostatic pressure gradient due to
gravity has been omitted for simplicity.
Finally the Rayleigh-Plesset Equation 2.12 relates the pressure p
and the bubble volume, τ=4πR3/3:
 | ......(6.49)
|
where pB, the pressure within the bubble, will be
represented by the sum of a partial pressure, pV, of the
vapor plus a partial
pressure of noncondensable gas as given in Equation 2.11.
Equations 6.47, 6.48, and 6.49 can, in
theory, be solved to find the unknowns p(xi ,t),
ui(xi ,t),
and τ(xi ,t) (or R(xi ,t)) for any
bubbly cavitating flow. In practice the nonlinearities
in the Rayleigh-Plesset equation and in the Lagrangian derivative,
D/Dt=∂/∂t+ui∂/∂xi,
present serious difficulties for all flows except those of the simplest
geometry. In the following sections several such flows are
examined in order to illustrate the interactive effects of bubbles
in cavitating flows and the role played by bubble dynamics in
homogeneous flows.
6.8 ACOUSTICS OF BUBBLY MIXTURES
One class of phenomena in which bubble dynamics can play an
important role is the acoustics of dilute bubbly mixtures.
When the acoustic excitation frequency approaches the
natural frequency of the bubbles, the latter no longer respond in the
quasistatic manner assumed in
Section 6.2, and both the propagation
speed and the acoustic attenuation are significantly altered.
An excellent review of this subject is given by van Wijngaarden (1972) and
we will include here only a summary of the key results. This class of
problems has the advantage that the magnitude of the perturbations is small
so that the equations of the preceding section can be greatly
simplified by linearization.
Hence the pressure, p, will be represented by the following sum:
 | ......(6.50)
|
where
 is the mean pressure, ω is the frequency,
and
 is the small amplitude pressure perturbation.
The response of a bubble
will be similarly represented by a perturbation,
 ,
to its mean
radius, Ro, such that
 | ......(6.51)
|
and the linearization will neglect all terms of order
 2 or higher.
The literature on the acoustics of dilute bubbly mixtures contains
two complementary analytical approaches. In important papers,
Foldy (1945) and Carstensen and Foldy (1947) applied the classical
acoustical approach and treated the problem of multiple scattering by
randomly distributed point scatterers representing the bubbles. The
medium is assumed to be very dilute (α « 1). The multiple
scattering produces both coherent and incoherent contributions.
The incoherent part is beyond the scope of this text. The coherent
part, which can be represented by Equation 6.50, was found
to satsify a
wave equation and yields a dispersion relation for the wavenumber,
k, of plane waves, which implies a phase velocity,
ck=ω/k,
given by (see van Wijngaarden 1972)
 | ......(6.52)
|
Here cL is the sonic speed in the liquid,
co is the sonic speed arising from
Equation 6.15 when
αρG « (1-α)ρL,
 | ......(6.53)
|
ωN is the natural frequency of a bubble in an infinite liquid
(Section 4.2),
and δD is a dissipation coefficient that will
be discussed shortly. It follows from Equation 6.52 that scattering
from the bubbles makes the wave propagation dispersive since
ck is
a function of the frequency, ω.
As described by van Wijngaarden (1972) an alternative approach is to
linearize the fluid mechanical Equations 6.47, 6.48, and 6.49, neglecting
any terms of order
 2
or higher. In the case of plane wave
propagation in the direction x (velocity u) in a frame of reference
relative to the mixture (so that the mean velocity is zero), the convective
terms in the Lagrangian derivatives, D/Dt, are of order
 2
and the three governing equations become
 | ......(6.54)
|
 | ......(6.55)
|
 | ......(6.56)
|
Assuming for simplicity that the liquid is incompressible
(ρL=constant) and eliminating two of the three
unknown functions from these relations, one obtains the following
equation for any one of the three perturbation quantities
(q=
 ,
,
 , or
, or
 , the velocity
perturbation):
 | ......(6.57)
|
where αo is the mean void fraction given by
αo=ητo/(1+ητo).
This equation governing the acoustic
perturbations is given by van Wijngaarden, though we have added the
surface tension term. Since the mean state must be in equilibrium, the
mean liquid pressure,
 ,
is related to pGo by
 | ......(6.58)
|
and hence the term in square brackets in
Equation 6.57 may be written in the
alternate forms
 | ......(6.59)
|
where ωN is the natural frequency of a single bubble in an infinite
liquid (see Section 4.2).
Results for the propagation of a plane wave in the positive x direction are
obtained by substituting q=e-jkx in
Equation 6.57 to produce
the following dispersion relation:
 | ......(6.60)
|
Note that at the low frequencies for which one would expect quasistatic bubble
behavior (ω « ωN) and in the absence of
vapor
(pV=0)
and surface tension, this reduces to the sonic velocity given by Equation
6.15 when
ρGα « ρL(1-α).
Furthermore, Equation 6.60
may be written as
 | ......(6.61)
|
where
δD=4νL/ωNRo2.
For the incompressible liquid assumed here this is identical to Equation
6.52 obtained using the Foldy multiple scattering approach
(the difference in sign for the damping term results from using
j(ωt-kx) rather than j(kx-ωt) and is
inconsequential).
In the above derivation, the only damping mechanism that was included
was that due to viscous effects on the radial motion of the
bubbles. As discussed in
Section 4.4, other damping mechanisms
(thermal and acoustic radiation) that may affect radial bubble motion
can be included in approximate form in the above analysis by defining
an ``effective'' damping, δD, or,
equivalently, an effective liquid viscosity,
μE=ωNRo2δD/4.
The real and imaginary parts of k as defined by Equation 6.61 lead
respectively to a sound speed and an attenuation that are both functions
of the frequency of the perturbations. A number of experimental
investigations have been carried out (primarily at very small α)
to measure the sound speed and attenuation in bubbly gas/liquid mixtures.
This data is reviewed by van Wijngaarden (1972) who concentrates on the more
recent experiments of Fox, Curley, and Lawson (1955), Macpherson (1957), and
Silberman (1957), in which the bubble size distribution was more
accurately measured and controlled. In general, the comparison
between the experimental and theoretical propagation speeds is good,
as illustrated by Figure 6.13. One of the primary experimental
difficulties illustrated in both
Figures 6.13 and 6.14 is that the
results are quite sensitive to the distribution of bubble sizes
present in the mixture. This is caused by the fact that the bubble
natural frequency is quite sensitive to the mean radius
(see Section 4.2).
Hence a distribution in the size of the bubbles yields broadening of
the peaks in the data of Figures 6.13 and 6.14.
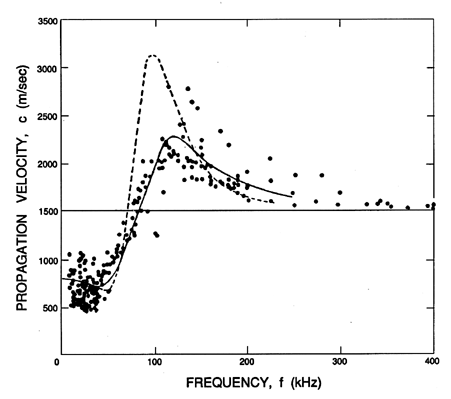
|
Figure 6.13
Sonic speed for water with air bubbles of mean radius,
Ro=0.12 mm, and a void fraction, α=0.0002,
plotted against frequency. The experimental data of Fox, Curley, and
Larson (1955) is plotted
along with the theoretical curve for a mixture with identical
Ro=0.11mm bubbles (dotted line) and with the experimental
distribution of sizes (solid line). These lines use δ=0.5.
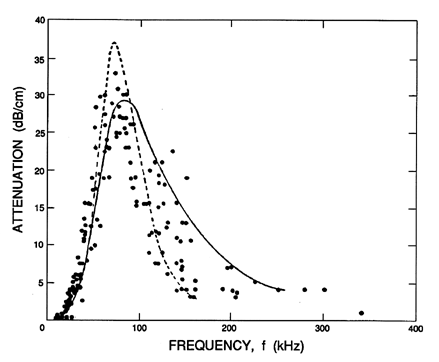
Figure 6.14
Values for the attenuation of sound waves corresponding to the
sonic speed data of Figure 6.13. The attenuation in dB/cm
is given by 8.69Im{k} where k is in cm-1.
Though the propagation speed is fairly well predicted by the theory,
the same cannot be said of the attenuation, and there remain a number
of unanswered questions in this regard. Using Equation 6.61 the
theoretical estimate of the damping coefficient, δD,
pertinent to the experiments of Fox, Curley, and Lawson (1955) is
0.093. But a much greater value of δD=0.5 had to be
used in order to produce an analytical line
close to the experimental data on attenuation; it is important to note
that the empirical value, δD=0.5, has been used for the
theoretical results in Figure 6.14.
On the other hand, Macpherson (1957)
found good agreement between a measured attenuation corresponding to
δD≈0.08 and the estimated analytical value of
0.079 relevant to his experiments. Similar good agreement was obtained for both
the propagation and attenuation by Silberman (1957).
Consequently, there appear to be some unresolved issues insofar as the
attenuation is concerned. Among the effects that were omitted in the
above analysis and that might contribute to the attenuation is the
effect of the relative motion of the bubbles.
However, Batchelor (1969) has concluded that the viscous effects of
translational motion would make a negligible contribution to the total
damping.
Finally, it is important to emphasize that virtually all of the reported
data on attenuation is confined to very small void fractions of the
order of 0.0005 or less. The reason for this is clear when one
evaluates the imaginary part of k from
Equation 6.61. At these small
void fractions the damping is proportional to α. Consequently,
at large void fraction of the order, say, of 0.05, the damping is
100
times greater and therefore more difficult to measure accurately.
6.9 SHOCK WAVES IN BUBBLY FLOWS
The propagation and structure of shock waves in bubbly cavitating
flows represent a rare circumstance in which fully nonlinear
solutions of the governing equations can be obtained. Shock wave
analyses of this kind have been investigated by Campbell and Pitcher
(1958), Crespo (1969), Noordzij (1973), and
Noordzij and van Wijngaarden (1974),
among others, and for more detail the reader should consult these works.
Since this chapter is confined to flows without significant relative
motion, this section will not cover some of the important effects
of relative motion on the structural evolution of shocks in bubbly
liquids. For this the reader is referred to Noordzij and van Wijngaarden
(1974).
Consider a normal shock wave in a coordinate system moving with the
shock so that the flow is steady and the shock stationary.
If x and u
represent a coordinate and the fluid velocity normal to the shock,
then continuity requires
 | ......(6.62)
|
where ρ1 and u1 will refer to the
mixture density and
velocity far upstream of the shock. Hence u1 is also the
velocity of propagation of a shock into a mixture with conditions
identical to those upstream of the shock. It is assumed that
ρ1≈ρL(1-α1)=ρL/(1+ητ1)
where the liquid density is considered constant
and α1,
τ1=4πR13/3, and
η are the void fraction, individual bubble volume, and population
of the mixture far upstream.
Substituting for ρ in the equation of motion and integrating,
one also obtains
 | ......(6.63)
|
This expression for the pressure, p, may be substituted into the
Rayleigh-Plesset equation using the
observation that, for this steady flow,
 | ......(6.64)
|
 | ......(6.65)
|
where τ=4πR3/3 has been used for clarity. It
follows that the structure of the flow is determined by solving the
following equation for R(x):
 | ......(6.66)
|
It will be found that dissipation effects in the bubble dynamics
(see Sections 4.3 and
4.4) strongly influence the structure of
the shock. Only one dissipative term, that term due to viscous
effects (last term on the left-hand side) has been included in
Equation 6.66. However, note that the other dissipative effects
may be incorporated approximately (see
Section 4.4) by regarding
νL as a total ``effective" damping viscosity.
The pressure
within the bubble is given by
 | ......(6.67)
|
and the equilibrium state far upstream must satisfy
 | ......(6.68)
|
Furthermore, if there exists an equilibrium state far downstream of
the shock (this existence will be explored shortly), then it follows
from Equations 6.66 and 6.67
that the velocity, u1, must be
related to the
ratio, R2/R1 (where
R2 is the bubble size
downstream of the shock), by
 | ......(6.69)
|
where α2 is the void fraction far downstream of the shock and
 | ......(6.70)
|
Hence the ``shock velocity,'' u1, is given by the
upstream flow
parameters α1,
(p1-pV)/ρL, and
2S/ρLR1,
the polytropic index, k, and the downstream void
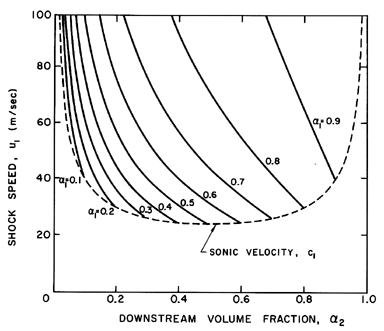
fraction, α2. An example of the dependence of
u1 on α1 and
α2
is shown in Figure 6.15 for
selected values of
(p1-pV)/ρL=100m2/sec2,
2S/ρLR1=0.1m2/sec2, and
k=1.4.
Also displayed by the dotted line in this
figure is the sonic velocity of the mixture, c1, under the
upstream conditions (actually the sonic velocity at zero frequency);
it is readily shown that c1 is given by
 | ......(6.71)
|
Figure 6.15
Shock speed, u1, as a function of the
upstream and downstream void fractions, α1 and
α2, for the
particular case
(p1-pV)/ρL=100 m2/sec2,
2S/ρLR1=0.1 m2/sec2,
and k=1.4. Also shown by the dotted line is the sonic
velocity, c1, under the same upstream conditions.
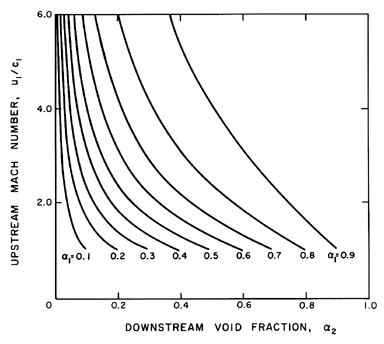
Alternatively, one may follow the presentation conventional in gas
dynamics and plot the upstream Mach number,
u1/c1,
as a function of α1 and α2.
The resulting graphs are functions
only of two parameters, the polytropic index, k, and the parameter,
R1(p1-pV)/S.
An example is included as
Figure 6.16 in which k=1.4 and
R1(p1-pV)/S=200.
It should be noted that a real shock velocity and a
real sonic speed can exist even when the upstream mixture is under
tension (p1<pV). However, the numerical
value
of the tension, pV -p1, for which the values are
real is limited to values of the parameter
R1(p1-pV)/2S > -(1-1/3k) or
-0.762 for k=1.4.
Also note that Figure 6.16 does not change much with the parameter,
R1(p1-pV)/S.
Figure 6.16
The upstream Mach number, u1/c1, as a
function of the upstream and downstream void fractions,
α1 and
α2, for k=1.4 and
R1(p1-pV)/S=200.
Bubble dynamics do not affect the results presented thus far since
the speed, u1, depends only on the equilibrium conditions
upstream and downstream. However, the existence and structure of the
shock depend on the bubble dynamic terms in Equation 6.66. That
equation is more conveniently written in terms of a radius ratio,
r=R/R1, and a dimensionless coordinate, z=x/R1:
 | ......(6.72)
|
It could also be written in terms of the void fraction, α, since
 | ......(6.73)
|
When examined in conjunction with the expression
in Equation 6.69 for u1,
it is clear that the solution, r(z) or α(z), for the
structure of the shock is a function only of
α1, α2, k,
R1(p1-pV)/S,
and the effective Reynolds number,
u1R1/νL, which, as
previously mentioned, should incorporate the various forms of bubble
damping.
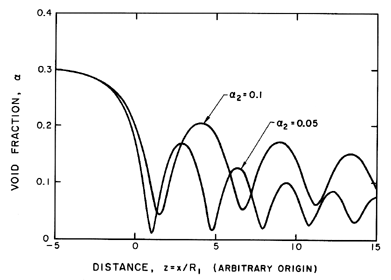
Figure 6.17
The typical structure of a shock wave in a
bubbly mixture is illustrated by these examples for
α1=0.3, k=1.4,
R1(p1-pV)/S » 1, and
u1R1/νL=100.
Equation 6.72 can be readily integrated numerically using Runge-Kutta
procedures, and typical solutions are presented in Figure 6.17 for
α1=0.3, k=1.4,
R1(p1-pV)/S » 1,
u1R1/νL=100, and two downstream
volume fractions,
α2=0.1 and 0.05. These examples illustrate several important
features of the structure of these shocks. First, the initial collapse
is followed by many rebounds and subsequent collapses. The decay of
these nonlinear oscillations is determined by the damping or
u1R1/νL. Though
u1R1/νL includes an effective
kinematic viscosity to incorporate other contributions to the bubble
damping, the value of
u1R1/νL chosen for this example
is probably smaller than would be relevant in many practical
applications, in which we might expect the decay to be even smaller.
It is also valuable to identify the nature of the solution as the
damping is eliminated
(u1R1/νL→∞). In this
limit the distance between collapses increases without bound until
the structure consists of one collapse followed by a downstream
asymptotic approach to a void fraction of
α1 ( not α2).
In other words, no solution in which
α→α2 exists in the
absence of damping.
|
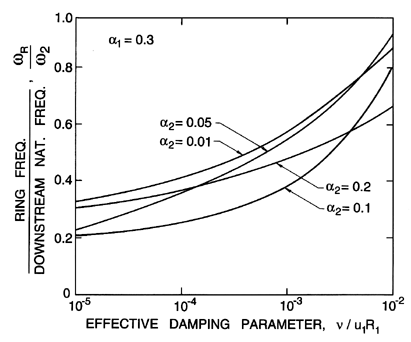
Figure 6.18
The ratio of the ring frequency downstream of
a bubbly mixture shock to the natural frequency of the bubbles far
downstream as a function of the effective damping parameter,
νL/u1R1, for
α1=0.3 and various downstream void fractions as
indicated.
Another important feature in the structure of these shocks is the
typical interval between the downstream oscillations. This ``ringing''
will, in practice, result in acoustic radiation at frequencies
corresponding to this interval, and it is of importance to identify the
relationship between this ring frequency and the natural frequency of
the bubbles downstream of the shock. A characteristic ring frequency,
ωR, for the shock oscillations can be defined as
 | ......(6.74)
|
where Δx is the distance between the first and second
bubble collapses. The natural frequency of the bubbles far
downstream of the shock, ω2, is given by
(see Section 4.2)
 | ......(6.75)
|
and typical values for the ratio
ωR/ω2 are presented in
Figure 6.18 for α1=0.3, k=1.4,
R1(p1-pV)/S » 1,
and various values of α2. Similar results were
obtained for
quite a wide range of values of α1. Therefore note
that the
frequency ratio is primarily a function of the damping and that ring
frequencies up to a factor of 10 less than the natural frequency are
to be expected with typical values of the damping in water. This reduction in
the typical frequency associated with the collective behavior of bubbles
presages the natural frequencies of bubble clouds, which are discussed in
the next section.
6.10 SPHERICAL BUBBLE CLOUD
A second illustrative example of the effect of bubble dynamics
on the behavior of a homogeneous bubbly mixture is the study of the
dynamics of a finite cloud of bubbles. Clouds of bubbles occur in
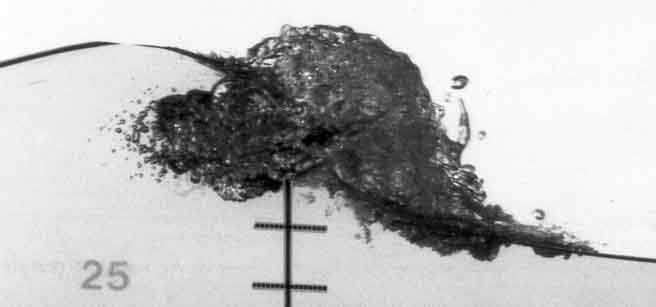
many circumstances. For example, breaking waves generate clouds of bubbles
as illustrated in Figure 6.19, and these affect the acoustic
environment in the ocean.
Figure 6.19
Photograph of a breaking wave showing the resulting cloud of
bubbles. The vertical distances between the crosses is about 5 cm.
Reproduced from Petroff (1993) with the author's permission.
One of the earliest investigations of the collective dynamics of bubble
clouds was the work of van Wijngaarden (1964) on the oscillations
of a layer of bubbles near a wall. Later d'Agostino
and Brennen (1983) investigated the dynamics of a spherical cloud
(see also d'Agostino and Brennen 1989, Omta 1987),
and we will choose the latter as a example of that class of problems
with one space dimension in which analytical solutions may be
obtained but only after linearization of the Rayleigh-Plesset
Equation 6.49.
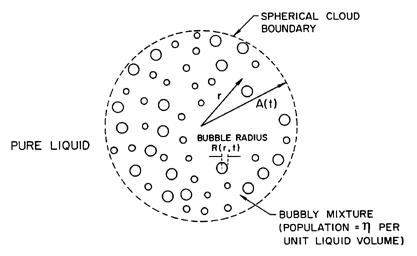 | Figure 6.20
Spherical cloud of bubbles: notation.
|
The geometry of the spherical cloud is shown in Figure 6.20. Within
the cloud of radius, A(t), the population of bubbles per unit
liquid
volume, η, is assumed constant and uniform. The linearization
assumes small perturbations of the bubbles from an
equilibrium radius, Ro:
 | ......(6.76)
|
We will seek the response of the cloud to a correspondingly small
perturbation in the pressure at infinity, p∞(t),
which is represented by
 | ......(6.77)
|
where
 is the mean, uniform pressure and
 and
ω
are the perturbation amplitude and frequency, respectively.
The solution will relate the
pressure, p(r,t), radial velocity, u(r,t), void fraction,
α(r,t), and bubble perturbation,
 (r,t), to
 .
Since the analysis
is linear, the response to excitation involving multiple frequencies can be
obtained by Fourier synthesis.
One further restriction is necessary in order to linearize the
governing Equations
6.47, 6.48, and 6.49. It is
assumed that the mean void fraction in the cloud, αo,
is small so that the term (1+ ητ) in Equations 6.47
and 6.48 is approximately unity. Then these equations become
 | ......(6.78)
|
 | ......(6.79)
|
It is readily shown that the velocity u is of order
 and hence
the convective component of the material derivative is of order
 2;
thus the linearization implies replacing
D/Dt by
∂/∂t. It then follows from the Rayleigh-Plesset
equation that to order

 | ......(6.80)
|
where ωN is the natural frequency of an individual
bubble if it were alone in an infinite fluid (equation 4.8).
It must be assumed that the bubbles are in stable equilibrium in the
mean state so that ωN is real.
Upon substitution of
Equations 6.76 and 6.80 into 6.78 and 6.79
and elimination of u(r,t) one obtains the following equation for
 (r,t)
in the domain r<A(t):
 | ......(6.81)
|
The incompressible liquid flow outside the cloud, r≥A(t), must
have the standard solution of the form:
 | ......(6.82)
|
 | ......(6.83)
|
where C(t) is of perturbation order. It follows that, to the first
order in
 (r,t),
the continuity of u(r,t) and p(r,t) at the
interface between the cloud and the pure liquid leads to the
following boundary condition for
 (r,t):
 | ......(6.84)
|
The solution of Equation 6.81 under the above boundary condition is
 | ......(6.85)
|
where:
 | ......(6.86)
|
Another possible solution involving cos λr/λr has
been eliminated since
 (r,t)
must clearly be finite as
r→0. Therefore in the domain r<Ao:
 | ......(6.87)
|
 | ......(6.88)
|
 | ......(6.89)
|
The entire flow has thus been determined in terms of the
prescribed quantities Ao, Ro,
η, ω, and
 .
.
Note first that the cloud has a number of
natural frequencies and
modes of oscillation. From
Equation 6.85 it follows that, if
 were
zero, oscillations would only occur if
 | ......(6.90)
|
and, therefore, using Equation 6.86 for λ, the natural
frequencies, ωN, of the cloud are found to be:
- ω∞=ωN, the natural
frequency of an individual bubble in an infinite liquid, and
-
ωN=ωN[1+16ηRoAo2/π(2n-1)2]½ ; n=1,2, ...,
which is an infinite series of frequencies of which ω1 is
the lowest. The higher frequencies approach ωN as
n tends to infinity.
The lowest natural frequency, ω1, can be written in terms
of the mean void fraction,
αo=ητo/(1+ητo),
as
 | ......(6.91)
|
Hence, the natural frequencies of the cloud will extend to frequencies
much smaller than the individual bubble frequency, ωN,
if the initial void fraction, αo,
is much larger than the
square of the ratio of bubble size to cloud size
(αo » Ro2/Ao2).
If the reverse is the case
(αo « Ro2/Ao2),
all the natural
frequencies of the cloud are contained in a small range just
below ωN.
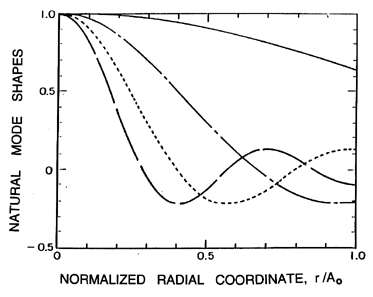
Typical natural modes of oscillation of the cloud are depicted in
Figure 6.21, where normalized amplitudes of the bubble radius and
pressure fluctuations are shown as functions of position,
r/Ao, within the cloud.
The amplitude of the radial velocity oscillation is
proportional to the slope of these curves. Since each bubble is
supposed to react to a uniform far field pressure, the validity
of the model is limited to wave numbers, n, such that
n « Ao/Ro. Note that the first mode involves
almost uniform oscillations of the bubbles at all radial positions
within the cloud. Higher modes involve amplitudes of oscillation
near the center of the cloud, which become larger and larger relative
to the amplitudes in the rest of the cloud. In effect, an outer
shell of bubbles essentially shields the exterior fluid from the
oscillations of the bubbles in the central core, with the result that the
pressure oscillations in the exterior fluid are of smaller amplitude
for the higher modes.
The corresponding shielding effects during forced excitation are
illustrated in Figure 6.22, which shows the distribution of the
amplitude of bubble radius oscillation,
| |, within
the cloud at various excitation frequencies, ω.
Note that, while the entire cloud
responds in a fairly uniform manner for ω<ωN,
only a surface layer of bubbles exhibits significant response when
ω>ωN. In the latter case the entire core of
the cloud is essentially shielded by the outer layer.
|
Figure 6.21
Natural mode shapes as a function of the
normalized radial position,
r/Ao, in the cloud for various orders n=1
(solid line), 2 (dash-dotted line), 3 (dotted line), 4 (broken line).
The arbitrary vertical scale represents the amplitude of the normalized
undamped oscillations of the bubble radius, the pressure, and the bubble
concentration per unit liquid volume. The oscillation of the
velocity is proportional to the slope of these curves.
Figure 6.22
The distribution of bubble radius oscillation amplitudes,
| |, within
a cloud subjected to forced excitation at various frequencies, ω, as
indicated (for the case of
αo(1-αo)Ao2/Ro2=0.822).
From d'Agostino and Brennen (1989).
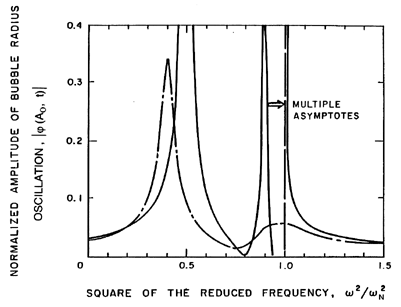
The variations in the response at different frequencies are shown in
more detail in Figure 6.23, in which the amplitude at the cloud
surface,
| (Ao,t)|,
is presented as a
function of ω.
The solid line corresponds to the above analysis, which did not include
any bubble damping. Consequently, there are asymptotes to infinity at
each of the cloud natural frequencies; for clarity we have omitted the
numerous asymptotes that occur just below the bubble natural frequency,
ωN. Also shown in this figure are the corresponding
results when a reasonable estimate of the damping is included in the analysis
(d'Agostino and Brennen 1989). The
attenuation due to the damping is much greater at the higher frequencies so
that, when damping is included (Figure 6.23),
the dominant feature of the response is the lowest natural frequency
of the cloud. The response at the bubble natural frequency becomes
much less significant.
|
Figure 6.23
The amplitude of the bubble radius oscillation at the cloud
surface,
| (Ao,t)|,
as a function of frequency (for the case of
αo(1-αo)Ao2/Ro2=0.822).
Solid line is without damping; broken line includes damping.
From d'Agostino and Brennen (1989).
The effect of varying the parameter,
αo(1-αo)Ao2/Ro2,
is shown in Figure 6.24.
Note that increasing the void fraction causes a reduction in both
the amplitude and frequency of the dominant response at the lowest
natural frequency of the cloud. d'Agostino and Brennen (1988) have
also calculated the acoustical absorption and scattering cross-sections
of the cloud that this analysis implies. Not surprisingly, the
dominant peaks in the cross-sections occur at the lowest cloud
natural frequency.
Figure 6.24
The amplitude of the bubble radius oscillation at the cloud
surface,
| (Ao,t)|,
as a function of frequency
for damped oscillations at three values of
αo(1-αo)Ao2/Ro2
equal to 0.822 (solid line),
0.411 (dot-dash line), and 1.65 (dashed line).
From d'Agostino and Brennen (1989).
It is important to emphasize that
the analysis presented above is purely linear and that there are likely
to be very significant nonlinear effects that may have a major effect
on the dynamics and acoustics of real bubble clouds. Hanson et al.
(1981) and Mørch (1980, 1981) visualize that the collapse of a cloud
of bubbles involves the formation and inward propagation of a shock
wave and that the focusing of this shock at the
center of the cloud
creates the enhancement of the noise and damage potential associated with
cloud collapse (see Section 3.7).
The deformations of the individual
bubbles within a collapsing cloud have been examined numerically
by Chahine and Duraiswami (1992), who showed that the bubbles on the
periphery of the cloud develop inwardly directed reentrant jets
(see Section 3.5).
Numerical investigations of the nonlinear
dynamics of cavity clouds have been carried out by Chahine (1982),
Omta (1987), and Kumar and Brennen (1991, 1992, 1993). Kumar and Brennen
have obtained weakly nonlinear solutions
to a number of cloud problems by retaining
only the terms that are quadratic in the amplitude; this analysis is
a natural extension of the weakly nonlinear solutions for a single
bubble described in Section 4.6. One
interesting phenomenon that emerges from this nonlinear analysis involves
the interactions between the bubbles of different size that would
commonly occur in any real cloud. The phenomenon, called
``harmonic cascading''
(Kumar and Brennen 1992), occurs when a relatively
small number of larger bubbles begins to respond nonlinearly to some
excitation. Then the higher harmonics produced will excite the much
larger number of smaller bubbles at their natural frequency. The process
can then be repeated to even smaller bubbles. In essence, this nonlinear
effect causes a cascading of fluctuation energy to smaller bubbles and
higher frequencies.
In all of the above we have focused, explicitly or implicitly, on spherical
bubble clouds. Solutions of the basic equations for other, more complex
geometries are not readily obtained. However, d'Agostino et al.
(1988) have examined some of the characteristics of this class of flows
past slender bodies (for example, the flow over a wavy surface). Clearly, in
the absence of bubble dynamics, one would encounter two types of flow:
subsonic and supersonic. Interestingly, the inclusion of bubble
dynamics leads to three types of flow. At sufficiently low speeds one
obtains the usual elliptic equations of subsonic flow. And when the
sonic speed is exceeded, the equations become hyberbolic and the flow
supersonic. However, with further increase in speed, the time rate
of change becomes equivalent to frequencies above the natural frequency
of the bubbles. Then the equations become elliptic again and a new
flow regime, termed ``super-resonant,''
occurs. d'Agostino et al.
(1988) explore the consequences of this and other features of these
slender body flows.
REFERENCES
-
Batchelor, G.K. (1969). In Fluid Dynamics Transactions, 4,
(eds: W.Fizdon, P.Kucharczyk, and W.J.Prosnak). Polish Sci. Publ., Warsaw.
-
Campbell, I.J. and Pitcher. A.S. (1958). Shock waves in a liquid containing
gas bubbles. Proc. Roy. Soc. London, A, 243, 534--545.
-
Carstensen, E.L. and Foldy, L.L. (1947). Propagation of sound through a
liquid containing bubbles.
J. Acoust. Soc. Amer.,
19, 481--501.
-
Chahine, G.L. (1982). Cloud cavitation: theory. Proc. 14th ONR Symp.
on Naval Hydrodynamics, 165--194.
-
Chahine, G.L. and Duraiswami, R. (1992). Dynamical interactions in a
multibubble cloud. ASME J. Fluids Eng., 114, 680--686.
-
Chapman, R.B. and Plesset, M.S. (1971). Thermal effects in the free
oscillation of gas bubbles. ASME J. Basic Eng., 93, 373--376.
-
Crespo, A. (1969). Sound and shock waves in liquids containing bubbles.
Phys. Fluids, 12, 2274--2282.
-
d'Agostino, L., and Brennen, C.E. (1983). On the acoustical dynamics
of bubble clouds. ASME Cavitation and Multiphase Flow Forum, 72--75.
-
d'Agostino, L., and Brennen, C.E. (1988). Acoustical absorption
and scattering cross-sections of spherical bubble clouds. J. Acoust.
Soc. Am., 84, 2126--2134.
-
d'Agostino, L., and Brennen, C.E. (1989). Linearized dynamics of
spherical bubble clouds. J. Fluid Mech., 199, 155--176.
-
d'Agostino, L., Brennen, C.E., and Acosta, A.J. (1988). Linearized
dynamics of two-dimensional bubbly and cavitating flows over slender surfaces.
J. Fluid Mech., 192, 485--509.
-
Foldy, L.L. (1945). The multiple scattering of waves.
Phys. Rev., 67, 107--119.
-
Fox, F.E., Curley, S.R., and Larson, G.S. (1955). Phase velocity and
absorption measurements in water containing air bubbles.
J. Acoust. Soc. Am., 27, 534--539.
-
Gouse, S.W. and Brown, G.A. (1964). A survey of the velocity of sound in
two-phase mixtures. ASME Paper 64-WA/FE-35.
-
Hanson, I., Kedrinskii, V.K., and Mørch, K.A. (1981). On the dynamics of
cavity clusters. J. Appl. Phys., 15, 1725--1734.
-
Henry, R.E. and Fauske, H.K. (1971). The two-phase critical flow of
one-component mixtures in nozzles, orifices, and short tubes.
ASME J. Heat Transfer, 93, 179--187.
-
Karplus, H.B. (1958). The velocity of sound in a liquid containing gas
bubbles. Illinois Inst. Tech. Rep. COO-248.
-
Kumar, S. and Brennen, C.E. (1991). Non-linear effects in the
dynamics of clouds of bubbles. J. Acoust. Soc. Am.,
89, 707--714.
-
Kumar, S. and Brennen, C.E. (1992). Harmonic cascading in
bubble clouds. Proc. Int. Symp. on Propulsors and Cavitation, Hamburg,
171--179.
-
Kumar, S. and Brennen, C.E. (1993). Some nonlinear interactive
effects in bubbly cavitation clouds. J. Fluid Mech., 253,
565--591.
-
Macpherson, J.D. (1957). The effect of gas bubbles on sound propagation
in water.
Proc. Phys. Soc. London, 70B, 85--92.
-
Maneely, D.J. (1962). A study of the expansion process of low quality steam
through a de Laval nozzle. Univ. of Calif. Radiation Lab.
Rep. UCRL-6230.
-
Minnaert, M. (1933). Musical air bubbles and the sound of running water.
Phil. Mag., 16, 235--248.
-
Mørch, K.A. (1980). On the collapse of cavity cluster in flow
cavitation. Proc. First Int. Conf. on Cavitation and Inhomogenieties
in Underwater Acoustics, Springer Series in Electrophysics, 4,
95--100.
-
Mørch, K.A. (1981). Cavity cluster dynamics and cavitation
erosion. Proc. ASME Cavitation and Polyphase Flow Forum, 1--10.
-
Muir, T.F. and Eichhorn, R. (1963). Compressible flow of an air-water
mixture through a vertical two-dimensional converging-diverging nozzle.
Proc. 1963 Heat Transfer and Fluid Mechanics Institute, Stanford Univ.
Press, 183--204.
-
Neusen, K.F. (1962). Optimizing of flow parameters for the expansion of
very low quality steam. Univ. of Calif. Radiation Lab. Rep. UCRL-6152.
-
Noordzij, L. (1973). Shock waves in mixtures of liquid and air bubbles.
Ph.D. Thesis, Technische Hogeschool, Twente, Netherlands.
-
Noordzij, L. and van Wijngaarden, L. (1974). Relaxation effects, caused
by relative motion, on short waves in gas-bubble/liquid mixtures.
J. Fluid Mech., 66, 115--143.
-
Omta, R. (1987). Oscillations of a cloud of bubbles of small and not
so small amplitude. J. Acoust. Soc. Am., 82, 1018--1033.
-
Petroff, C. (1993). The interaction of breaking solitary waves with an
armored bed. Ph.D. Thesis, Calif. Inst. of Tech.
-
Silberman, E. (1957). Sound velocity and attenuation in bubbly mixtures
measured in standing wave tubes. J. Acoust. Soc. Am.,
18, 925--933.
-
Symington, W.A. (1978). Analytical studies of steady and non-steady
motion of a bubbly liquid. Ph.D. Thesis, Calif. Inst. of Tech.
-
Tangren, R.F., Dodge, C.H., and Seifert, H.S. (1949). Compressibility
effects in two-phase flow.
J. Appl. Phys., 20, No. 7, 637--645.
-
van Wijngaarden, L. (1964). On the collective collapse of a large number
of gas bubbles in water. Proc. 11th Int. Cong. Appl. Mech.,
Springer-Verlag, Berlin, 854--861.
-
van Wijngaarden, L. (1972). One-dimensional flow of liquids containing
small gas bubbles.
Ann. Rev. Fluid Mech., 4, 369--396.
Back to table of contents
Last updated 12/1/00.
Christopher E. Brennen




 C, follows as
ρ*A*c*
where A* is the cross-sectional area of the throat and


 /A*(poρo)½,
as a function of αo for choked flow
of a gas/liquid flow through a nozzle. Solid lines are incompressible
liquid results for polytropic indices of 1.4 and 1.0. Dashed line shows
effect of liquid compressibility for
po/ρLcL2=0.05. The
experimental data (circles) are from Muir and Eichhorn (1963).


 C/A*(ρopo)½,
are also readily calculated from


 /A*(poρo)½,
plotted against the reservoir vapor
volume fraction, αo, for water/steam mixtures.
The data shown is from the experiments
of Maneely (1962) and Neusen (1962) for 100→200 psia
(plus signs), 200→300 psia (×),
300→400 psia (squares), 400→500 psia (triangles),
500→600 psia (upsidedown triangles) and
>600 psia (asterisks).
The theoretical lines use
g*=1.67, η=0.73, gV=0.91, and
fV=0.769 for water.


 is the mean pressure, ω is the frequency,
and
 is the small amplitude pressure perturbation.
The response of a bubble
will be similarly represented by a perturbation,
 ,
to its mean
radius, Ro, such that

 2 or higher.


 2
or higher. In the case of plane wave
propagation in the direction x (velocity u) in a frame of reference
relative to the mixture (so that the mean velocity is zero), the convective
terms in the Lagrangian derivatives, D/Dt, are of order
 2
and the three governing equations become


 ,
,
 , or
, or
 , the velocity
perturbation):

 ,
is related to pGo by










 is the mean, uniform pressure and
 and
ω
are the perturbation amplitude and frequency, respectively.
The solution will relate the
pressure, p(r,t), radial velocity, u(r,t), void fraction,
α(r,t), and bubble perturbation,
 (r,t), to
 .
Since the analysis
is linear, the response to excitation involving multiple frequencies can be
obtained by Fourier synthesis.


 and hence
the convective component of the material derivative is of order
 2;
thus the linearization implies replacing
D/Dt by
∂/∂t. It then follows from the Rayleigh-Plesset
equation that to order


 (r,t)
in the domain r<A(t):


 (r,t),
the continuity of u(r,t) and p(r,t) at the
interface between the cloud and the pure liquid leads to the
following boundary condition for
 (r,t):


 (r,t)
must clearly be finite as
r→0. Therefore in the domain r<Ao:


 .
.
 were
zero, oscillations would only occur if


 |, within
the cloud at various excitation frequencies, ω.
Note that, while the entire cloud
responds in a fairly uniform manner for ω<ωN,
only a surface layer of bubbles exhibits significant response when
ω>ωN. In the latter case the entire core of
the cloud is essentially shielded by the outer layer.

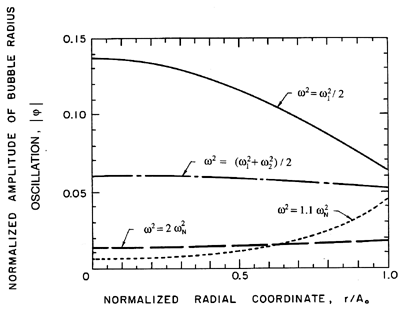
 |, within
a cloud subjected to forced excitation at various frequencies, ω, as
indicated (for the case of
αo(1-αo)Ao2/Ro2=0.822).
From d'Agostino and Brennen (1989).
 (Ao,t)|,
is presented as a
function of ω.
The solid line corresponds to the above analysis, which did not include
any bubble damping. Consequently, there are asymptotes to infinity at
each of the cloud natural frequencies; for clarity we have omitted the
numerous asymptotes that occur just below the bubble natural frequency,
ωN. Also shown in this figure are the corresponding
results when a reasonable estimate of the damping is included in the analysis
(d'Agostino and Brennen 1989). The
attenuation due to the damping is much greater at the higher frequencies so
that, when damping is included (Figure 6.23),
the dominant feature of the response is the lowest natural frequency
of the cloud. The response at the bubble natural frequency becomes
much less significant.

 (Ao,t)|,
as a function of frequency (for the case of
αo(1-αo)Ao2/Ro2=0.822).
Solid line is without damping; broken line includes damping.
From d'Agostino and Brennen (1989).
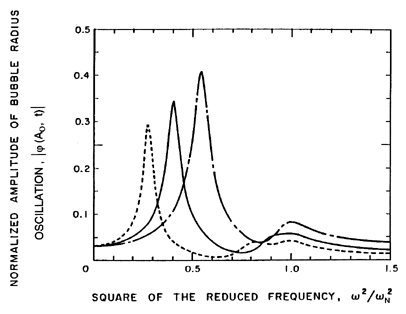
 (Ao,t)|,
as a function of frequency
for damped oscillations at three values of
αo(1-αo)Ao2/Ro2
equal to 0.822 (solid line),
0.411 (dot-dash line), and 1.65 (dashed line).
From d'Agostino and Brennen (1989).