CAVITATION AND BUBBLE DYNAMICS
by Christopher Earls Brennen © Oxford University Press 1995
CHAPTER 7.
CAVITATING FLOWS
7.1 INTRODUCTION
We begin this discussion of cavitation in flows by describing the effect of the flow on a single cavitation ``event.'' This is the term used in referring to the processes that occur when a single cavitation nucleus is convected into a region of low pressure within the flow, grows explosively to macroscopic size, and collapses when it is convected back into a region of higher pressure. Pioneering observations of individual cavitation events were made by Knapp and his associates at the California Institute of Technology in the 1940s (see, for example, Knapp and Hollander 1948) using high-speed movie cameras capable of 20,000 frames per second. Shortly thereafter Plesset (1948), Parkin (1952), and others began to model these observations of the growth and collapse of traveling cavitation bubbles using modifications of Rayleigh's original equation of motion for a spherical bubble. Many analyses and experiments on traveling bubble cavitation followed, and a brief description these is included in the next section. All of the models are based on two assumptions: that the bubbles remain spherical and that events do not interact with one another.
However, observations of real flows demonstrate that even single cavitation bubbles are often far from spherical. Indeed, they may not even be single bubbles but rather a cloud of smaller bubbles. Departure from sphericity is often the result of the interaction of the bubble with the pressure gradients and shear forces in the flow or the interaction with a solid surface. In Section 7.3 we describe some of these effects while still assuming that the events are sufficiently far apart in space and time that they do not interact with one another or modify the global liquid flow in any significant way. Often the words ``limited cavitation'' are used to distinguish these circumstances from the more complex phenomena that occur at higher event densities.
When the frequency of cavitation events increases in space or time such that they begin to interact with one another, a whole new set of phenomena may be manifest. They may begin to interact hydrodynamically, and some of the resulting phenomena are described and analysed in Chapter 6. Often these interaction phenomena can have important practical consequences as is the case, for example, with cloud cavitation (see Section 3.7).
But increase in the density of events also causes the formation of large-scale cavitation structures either because of the coalescence of individual bubbles (often because they accumulate in regions of recirculating flow) or because a large region of the flow vaporizes. Typical large-scale structures include cavitating vortices and attached cavities. As a result, cavitating flows can exhibit a number of different kinds of cavitation; later in this chapter we shall describe some of the forms that large-scale cavitation structures can take. Some of the analytical methods used to understand and predict these structures are discussed in the next chapter.
7.2 TRAVELING BUBBLE CAVITATION
Since the early work by Plesset (1948) had demonstrated some approximate validity for models of cavitation events that use the equation we now refer to as the Rayleigh-Plesset equation, Parkin (1952) was motivated to attempt a more detailed model for the growth of traveling cavitation bubbles in the flow around a body. It was assumed that the bubbles began as micron-sized nuclei in the liquid of the oncoming stream and that the bubble moved with the liquid velocity along a streamline close to the solid surface. Cavitation inception was deemed to occur when the bubbles reached an observable size of the order of 1 mm. Parkin believed the lack of agreement between this theory and the experimental observations was due to the neglect of the boundary layer. Subsequent experiments by Kermeen, McGraw, and Parkin (1955) revealed that cavitation could result either from free stream nuclei as earlier assumed or from nuclei originating from imperfections in the headform surface, which would detach when they reached a critical size. Later, Arakeri and Acosta (1973) observed that, if separation occurs close to the low-pressure region, then free stream nuclei could not only be supplied to the cavitating zone by the oncoming stream but could also be supplied by the recirculating flow downstream of separation. Under such circumstances some of these recirculating nuclei could be remnants from a cavitation event itself, and hence there exists the possibility of hysteretic effects. Though the supply of nuclei either from the surface or from downstream may occasionally be important, the majority of the experimental observations indicate that the primary supply is from nuclei present in the incident free stream. Other viscous boundary layer effects on cavitation inception and on traveling bubble cavitation are reviewed by Holl (1969) and Arakeri (1979).
Rayleigh-Plesset models of traveling bubble cavitation that attempted to incorporate the effects of the boundary layer include the work of Oshima (1961) and Van der Walle (1962). Holl and Kornhauser (1970) added the thermal effects on bubble growth and explored the influence of initial conditions such as the size and location of the nucleus. Like Parkin's (1952) original model these improved versions continued to assume that the nucleus or bubble moves along a streamline with the fluid velocity. However, Johnson and Hsieh (1966) showed that since the streamlines that encounter the low-pressure region are close to the surface and, therefore, close to the stagnation streamline, nuclei will experience large fluid accelerations and pressure gradients as they pass close to the front stagnation point. The effect is to force the nuclei to move outwards away from the stagnation streamline. Moreover, the larger nuclei, which are those most likely to cavitate, will be displaced more than the smaller nuclei. Johnson and Hsieh termed this the ``screening'' effect, and more recent studies have confirmed its importance in cavitation inception. But this screening effect is only one of the effects that the accelerations and pressure gradients in the flow can have on the nucleus and on the growing and collapsing cavitation bubble. In the next section we turn to a description of these interactions.
The maximum-modulus theorem states that maxima of a harmonic function must occur on the boundary and not in the interior of the region of solution of that function (see, for example, Titchmarsh 1947). Consequently, a pressure minimum in a steady, inviscid, potential flow must occur on the boundary of that flow (see Kirchhoff 1869, Birkhoff and Zarantonello 1957). Moreover, real fluid effects in many flows do not alter the fact that the minimum pressure occurs at or close to a solid surface. Perhaps the most common exception to this rule is in vortex cavitation, where the unsteady effects and/or viscous effects associated with vortex shedding or turbulence cause deviation from the maximum-modulus theorem; but discussion of this type of cavitation is delayed until later. In the many flows in which the minimum pressure does occur on a boundary, it follows that the cavitation bubbles that form in the vicinity of that point are likely to be affected by and to interact with that boundary, which we will assume is a solid surface. We observe, furthermore, that any curvature of the solid surface or, more specifically, of the streamlines in the vicinity of the minimum pressure point will cause pressure gradients normal to the surface, which are often substantially larger than those in the streamwise direction. These normal pressure gradients will force the bubble toward the surface and may cause substantial departure from sphericity. Consequently, even before boundary layer effects are factored into the picture, it is evident that the dynamics of individual cavitation bubbles may be significantly altered by interactions with the nearby solid surface and the flow near that surface. In this section we focus attention on these bubble/wall or bubble/flow interactions (grouped together in the term bubble/flow interactions).
Before describing some of the experimental observations of bubble/flow interactions, it is valuable to consider the relative sizes of the cavitation bubbles and the viscous boundary layer. In the flow of a uniform stream of velocity, U, around an object such as a hydrofoil with typical dimension, ℓ, the thickness of the laminar boundary layer near the minimum pressure point will be given qualitatively by δ=(νLℓ /U)½. Parenthetically, we note that transition to turbulence usually occurs downstream of the point of minimum pressure, and consequently the appropriate boundary layer thickness for limited cavitation confined to the immediate neighborhood of the low-pressure region is the laminar boundary layer thickness. Moreover, the approximate analysis of Section 2.5 yields a typical maximum bubble radius, RM, given by
 | ......(7.1) |
 | ......(7.2) |
Some of the early (and classic) observations of individual traveling cavitation bubbles by Knapp and Hollander (1948), Parkin (1952), and Ellis (1952) make mention of the deformation of the bubbles by the flow. But the focus of attention soon shifted to the easier observations of the dynamics of individual bubbles in quiescent liquid, and it is only recently that investigations of the deformation caused by the flow have resumed. Both Knapp and Hollander (1948) and Parkin (1952) observed that almost all cavitation bubbles are closer to hemispherical than spherical and that they appear to be separated from the solid surface by a thin film of liquid. Such bubbles are clearly evident in other photographs of traveling cavitation bubbles on a hydrofoil such as those of Blake et al. (1977) or Briançon-Marjollet et al. (1990).
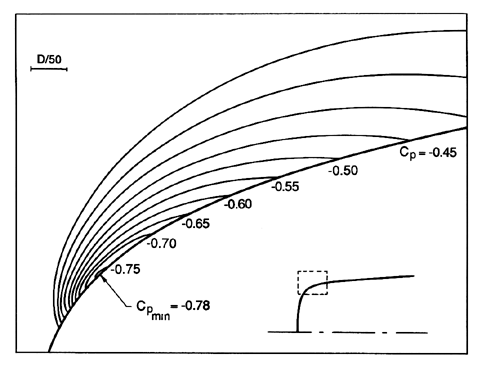
A number of recent research efforts have focused on these bubble/flow interactions, including the work of van der Meulen and van Renesse (1989) and Briançon-Marjollet et al. (1990). Recently, Ceccio and Brennen (1991) and Kuhn de Chizelle et al. (1992a,b) have made an extended series of observations of cavitation bubbles in the flow around axisymmetric bodies, including studies of the scaling of the phenomena. Two axisymmetric body shapes were used, both of which have been employed in previous cavitation investigations. The first of these was a so-called ``Schiebe body'' (Schiebe 1972) which is one of a series based on the solutions for the potential flow generated by a normal source disk (Weinstein 1948) and first suggested for use in cavitation experiments by Van Tuyl (1950). One of the important characteristics of this shape is that the boundary layer does not separate in the region of low pressure within which cavitation bubbles occur. The second body had the ITTC headform shape originally used by Lindgren and Johnsson (1966) for the comparative experiments described in Section 1.15. This headform exhibits laminar separation within the region in which the cavitation bubbles occur. For both headforms, the isobars in the neighborhood of the minimum pressure point exhibit a large pressure gradient normal to the surface, as illustrated by the isobars for the Schiebe body shown in Figure 7.1. This pressure gradient is associated with the curvature of the body and therefore the streamlines in the vicinity of the minimum pressure point. Consequently, at a given cavitation number, σ, the region below the vapor pressure that is enclosed between the solid surface and the Cp= -σ isobaric surface is long and thin compared with the size of the headform. Only nuclei that pass through this thin volume will cavitate.
|
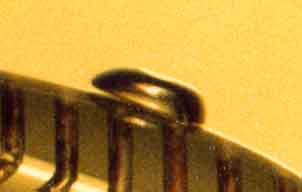
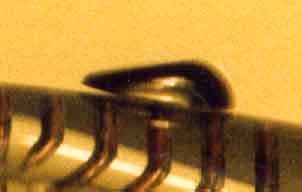
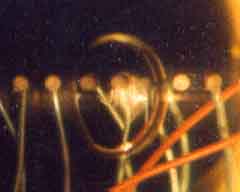
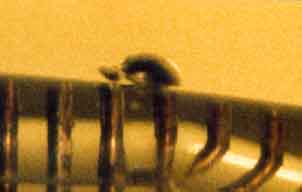
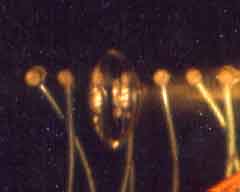
The observations of Ceccio and Brennen (1991) at lower Reynolds numbers will be described first. Typical photographs of bubbles on the 5.08cm diameter Schiebe headform during the cycle of bubble growth and collapse are shown in Figure 7.2. Simultaneous profile and plan views provide a more complete picture of the bubble geometry. In all cases the shape during the initial growth phase was that of a spherical cap, the bubble being separated from the wall by a thin layer of liquid of the same order of magnitude as the boundary layer thickness. Later developments depend on the geometry of the headform and the Reynolds number, so we begin with the simplest case, that of the Schiebe body at relatively low Reynolds number. Typical photographs for this case are included in Figure 7.2. As the bubble begins to enter the region of adverse pressure gradient, the exterior frontal surface begins to be pushed inward, causing the profile of the bubble to appear wedge-like. Thus the collapse is initiated on the exterior frontal surface of the bubble, and this often leads to the bubble fissioning into forward and aft bubbles as seen in Figure 7.2.
| 
| |
| 
| |
| 
| |
| 
|
Two other processes are occuring at the same time. First, the streamwise thickness of the bubble decreases faster than its spanwise breadth (spanwise being defined as the direction parallel to the headform surface and normal to the oncoming stream), so that the largest dimension of the bubble is its spanwise breadth. Second, the bubble acquires significant spanwise vorticity through its interactions with the boundary layer during the growth phase. Consequently, as the collapse proceeds, this vorticity is concentrated and the bubble evolves into one (or two or possibly more) cavitating vortex with a spanwise axis. These vortex bubbles proceed to collapse and seem to rebound as a cloud of much smaller bubbles. Often a coherent second collapse of this cloud was observed when the bubbles were not too scattered by the flow. Ceccio and Brennen (1991) (see also Kumar and Brennen 1993) conclude that the flow-induced fission prior to collapse can have a substantial effect on the noise impulse (see Section 3.8).
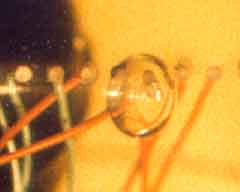
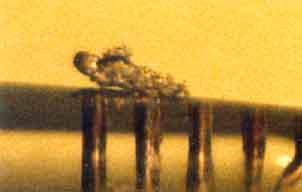
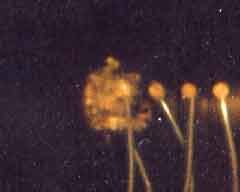
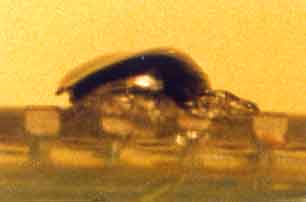
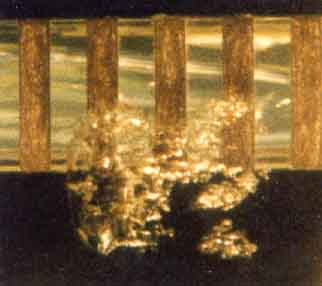
Two additional phenomena were observed on the ITTC headform, which exhibited laminar separation. The first of these was the observation that the layer of liquid underneath the bubble would become disrupted by some instability. As seen in Figure 7.3, this results in a bubbly layer of fluid that subsequently gets left behind the main bubble. Thus the instability of the liquid layer leads to another process of bubble fission. Because of the physical separation, the bubbly layer would collapse after the main body of the bubble.
| 
| |
| 
|
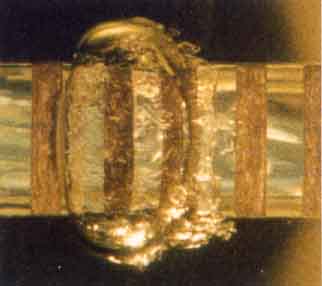
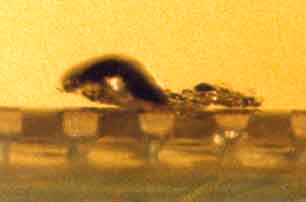
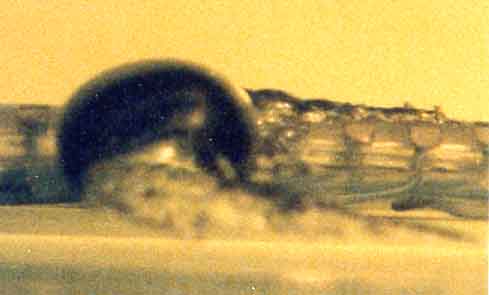
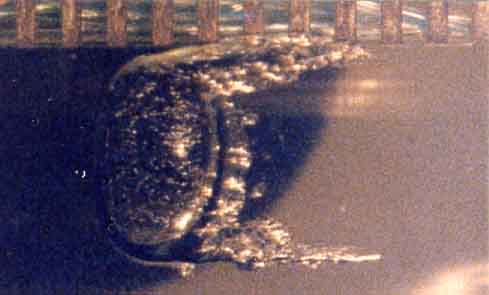
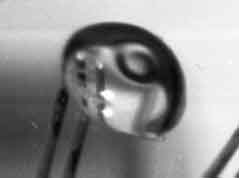
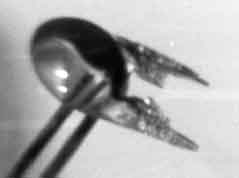
The second and perhaps more consequential phenomenon observed with the ITTC headform only occurs with the occasional bubble. Infrequently, when a bubble passes the point of laminar separation, it triggers the formation of local ``attached cavitation'' streaks at the lateral or spanwise extremities of the bubble, as seen in Figure 7.4. Then, as the main bubble proceeds downstream, these ``streaks'' or ``tails'' of attached cavitation are stretched out behind the main bubble, the trailing ends of the tails being attached to the solid surface. Subsequently, the main bubble collapses first, leaving the ``tails'' to persist for a fraction longer, as illustrated by the lower photograph in Figure 7.4.
| 
| |
| ||
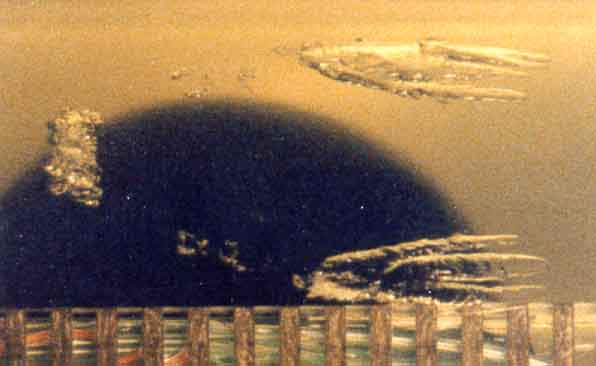
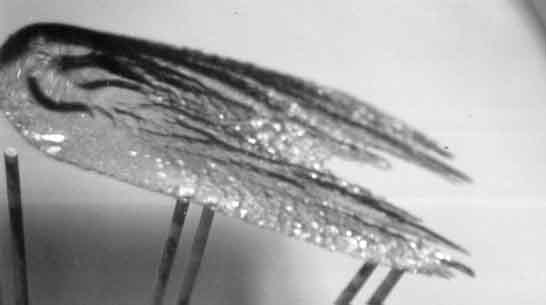
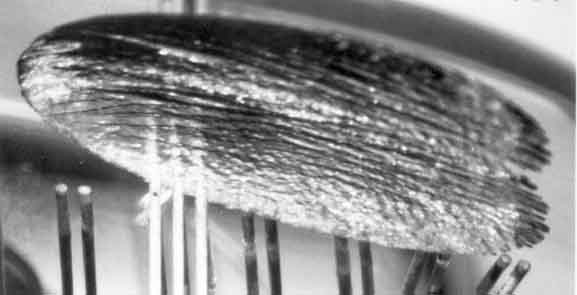
The importance of these occasional ``events with tails'' did not become clear until tests were conducted at much higher Reynolds numbers, with larger headforms (up to 50.5cm in diameter) and somewhat higher speeds (up to 15m/s). These tests were part of an investigation of the scaling of the bubble dynamic phenomena described above (Kuhn de Chizelle et al. 1992a,b). One notable observation was the presence of a ``dimple'' on the exterior surface of all the individual traveling bubbles; examples of this dimple are included in Figure 7.5. They are not the precursor to a reentrant jet, for the dimple seems to be relatively stable during most of the collapse process. More importantly, it was observed that, at higher Reynolds number, ``attached tails'' occurred even on these Schiebe bodies, which did not normally exhibit laminar separation. Moreover, the probability of occurence of attached tails increased as the Reynolds number increased and the attached cavitation began to be more extensive. As the Reynolds number increased further, the bubbles would tend to trigger attached cavities over the entire wake of the bubble as seen in the lower two photographs in Figure 7.5. Moreover, the attached cavitation would tend to remain for a longer period after the main bubble had disappeared. Eventually, at the highest Reynolds numbers tested, it appeared that the passage of a single bubble was sufficient to trigger a ``patch'' of attached cavitation (Figure 7.5, bottom), which would persist for an extended period after the bubble had long disappeared. This progression of events and the changes in the probabilities of the different kinds of events with Reynolds number imply a rich complexity in the micro-fluidmechanics of cavitation bubbles, much of which remains to be understood. Its importance lies in the fact that these different types of events cause differences in the collapse process which, in turn, alters the noise produced (see Kuhn de Chizelle et al. 1992b) and, in all probability, the potential for cavitation damage. For example, the events with attached tails were found to produce significantly less noise than the events without tails. Due to the changes in the probabilities of occurence of these events with Reynolds number, this implies a scaling effect that had not been previously recognized. It also suggests some possible strategies for the reduction of cavitation noise and damage.
| 
| |
| ||
| ||
When examined in retrospect, one can identify many of these phenomena in earlier photographic observations, including the pioneering, high-speed movies taken by Knapp. As previously noted, Knapp and Hollander (1948), Parkin (1952), and others noted the spherical-cap shape of most traveling cavitation bubbles. The ITTC experiments (Lindgren and Johnsson 1966) emphasized the diversity in the kinds of cavitation events that could occur on a given body, and later authors attempted to identify, understand, and classify this spectrum of events. For example, Holl and Carroll (1979) observed a variety of different types of cavitation events on axisymmetric bodies and remarked that both traveling and attached cavitation ``patches'' occurred and could be distinguished from traveling bubble cavitation. A similar study of the different types of cavitation events was reported by Huang (1979), whose ``spots'' are synonymous with ``patches.''
7.5 LARGE-SCALE CAVITATION STRUCTURES
When the density of cavitation events becomes large enough, they begin to interact and to alter the flow in a significant way. This increase in density may come about as a result of a decrease in the cavitation number, which causes the activation of increasingly smaller nuclei, or it may result from an increase in the population of nuclei in the oncoming stream. As long as the interaction effects are small, they seem to cause a decrease in the rate of growth of the bubbles (see, for example, Arakeri and Shanmuganathan 1985) and a shift in the spectrum of the cavitation noise (see, for example, Marboe, Billet, and Thompson 1986). Significant progress has been made in developing analytical models that incorporate such weak interaction effects on traveling bubble cavitation; these models are described in Chapter 6.
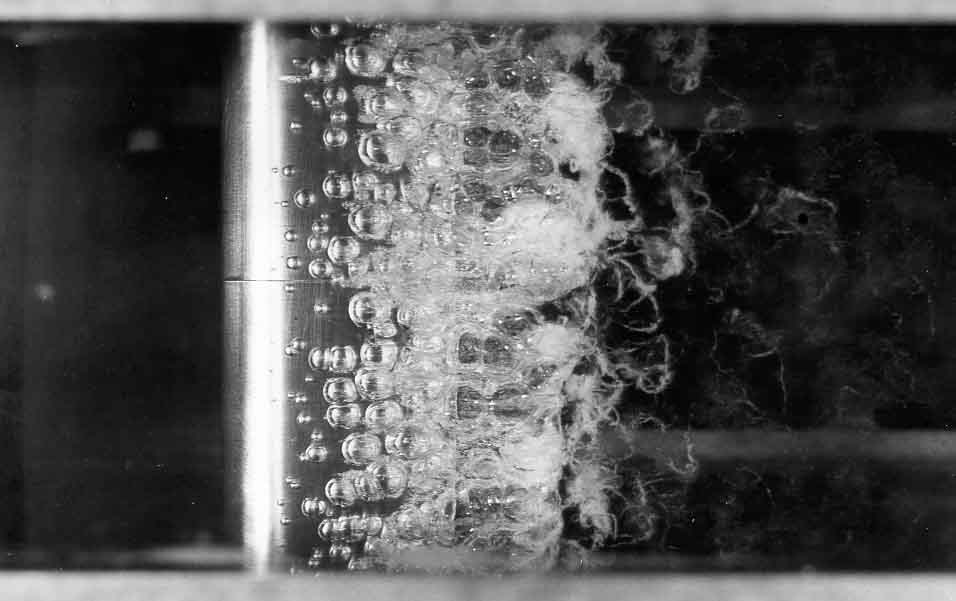
An example of dense traveling bubble cavitation is included in Figure 7.6. Note that the bubbles seem to merge to form a single vapor-filled wake near the trailing edge of the foil. Notice also the wispy trails of very small air bubbles that remain after the vapor-filled cavity collapses. In a water tunnel special efforts are required to allow these fine bubbles sufficient time to dissolve before they recirculate back to the working section. Without such efforts the population of small bubbles in the tunnel would quickly reach unacceptable levels. Even with special efforts it is clear that cavitation itself contributes to the population of nuclei in a closed loop water tunnel.
|
The large-scale cavitation structures that are formed when the cavitation number is reduced can take a variety of forms, and we review these in the next few sections. In many practical devices such as pumps or propellers, the first large-scale structure to be observed as the cavitation number is decreased takes the form of a cavitating vortex, so we begin with a discussion of vortex cavitation.
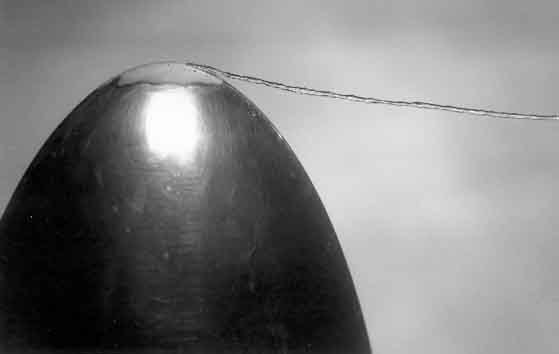
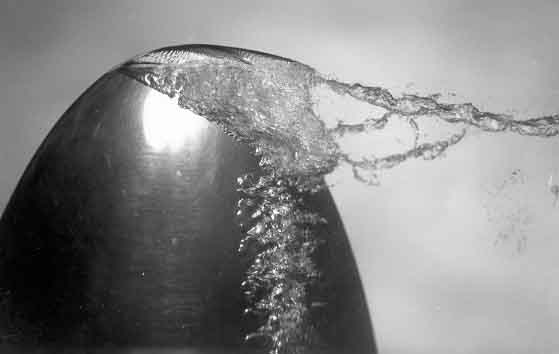
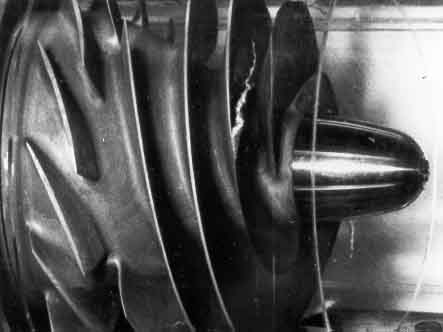
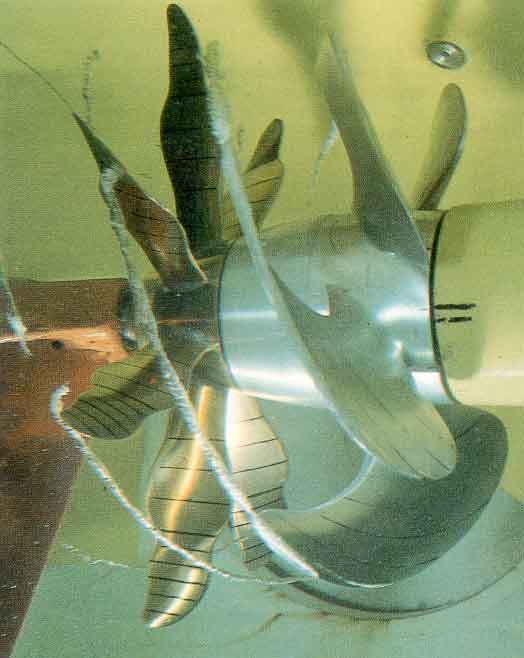
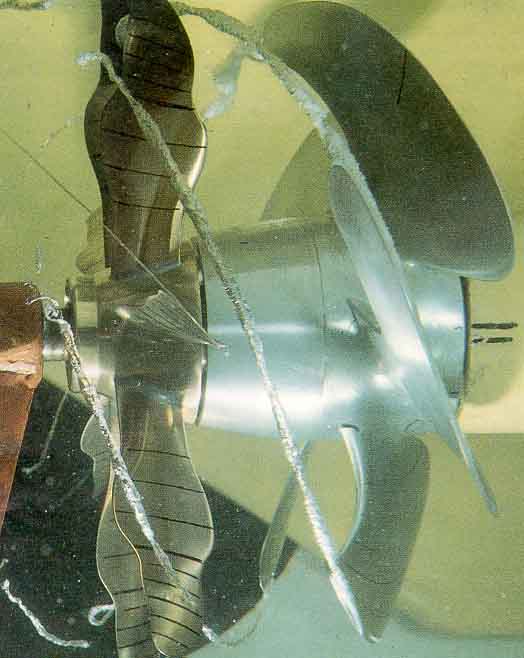
Many high Reynolds number flows of practical importance contain a region of concentrated vorticity where the pressure in the vortex core is often significantly smaller than in the rest of the flow. Such is the case, for example, in the tip vortices of ship's propellers or pump impellers or in the swirling flow in the draft tube of a water turbine. It follows that cavitation inception often occurs in these vortices and that, with further reduction of the cavitation number, the entire core of the vortex may become filled with vapor. Naturally, the term ``vortex cavitation'' is used for these circumstances. In Figures 7.7 to 7.12 we present some examples of this particular kind of large-scale cavitation structure. Figure 7.7 consists of photographs of cavitating tip vortices on a finite aspect ratio hydrofoil at an angle of attack. In those experiments of Higuchi, Rogers, and Arndt (1986) cavitation inception occurred in the vortex some distance downstream of the tip at a cavitation number of about σ=1.4. With further decrease in pressure the cavitation in the core becomes continuous, as illustrated by the picture on the left in Figure 7.7. This transition is probably triggered by an accumulation of individual bubbles in the core; they will tend to migrate to the center of the vortex due to the centrifugal pressure gradient. With further decrease in σ, bubble and/or sheet cavitation appear on the hydrofoil surface (Figure 7.7, photograph on right) and disturb the tip vortex which is nevertheless still apparent. Cavitating tip vortices are also quite apparent in unshrouded pump impellers as illustrated by Figure 7.8.
| 
|
|
When continuous cavitating tip vortices occur at the tips of the blades of a propeller they create a surprisingly stable flow structure. As illustrated by Figure 7.9 the intertwined, helical cavitating vortices from the blade tips can persist for a long distance downstream of the propeller.
| 
|
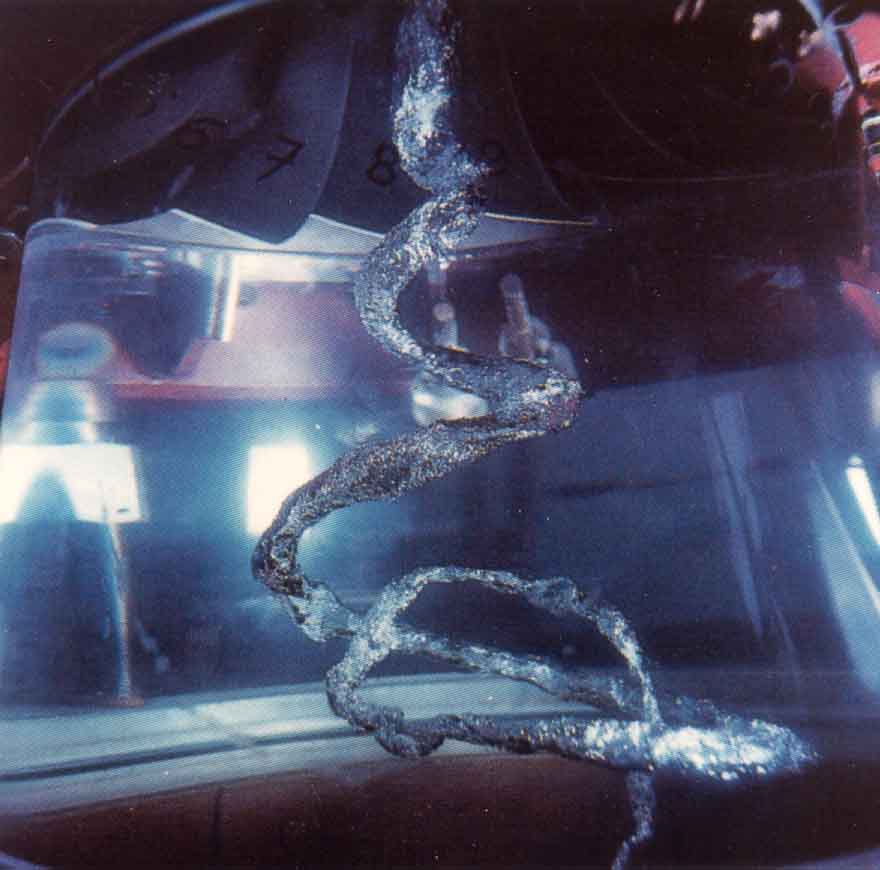
Clearly cavitation can occur in any vortex, and Figures 7.10 and 7.11 present two further examples. Figure 7.10 shows a typical picture of a cavitating vortex in the swirling flow in the draft tube of a Francis turbine. Often these draft tube vortices can exhibit quite complex patterns of unsteady flow.
|
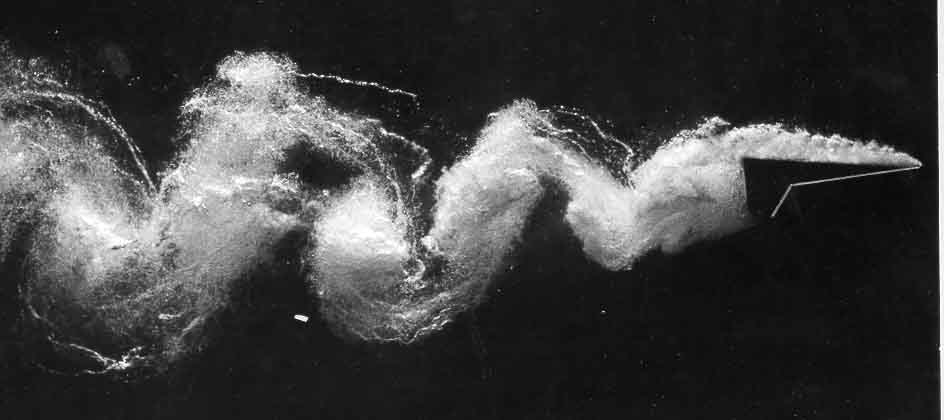
The vortices in a turbulent mixing layer or wake will also cavitate, as illustrated in Figure 7.11, a photograph of the separated wake behind a lifting flat plate with a flap. Looking closely at the structures in this turbulent flow, one can identify not only the large transverse vortices that contain many bubbles, but also the filament-like longitudinal vortices first identified in a single-phase mixing layer flow by Bernal and Roshko (1986). After that discovery by Bernal and Roshko one could recognize this secondary vortex structure in photographs of cavitating wakes and mixing layers taken many years previously, and yet its importance was not appreciated at the time. The streamwise vortices can play a particularly important role in cavitation inception. Katz and O'Hern (1986) have shown that, when streamwise vortices are present, inception occurs in these longitudinal structures before it occurs in the primary or transverse vortices.
|
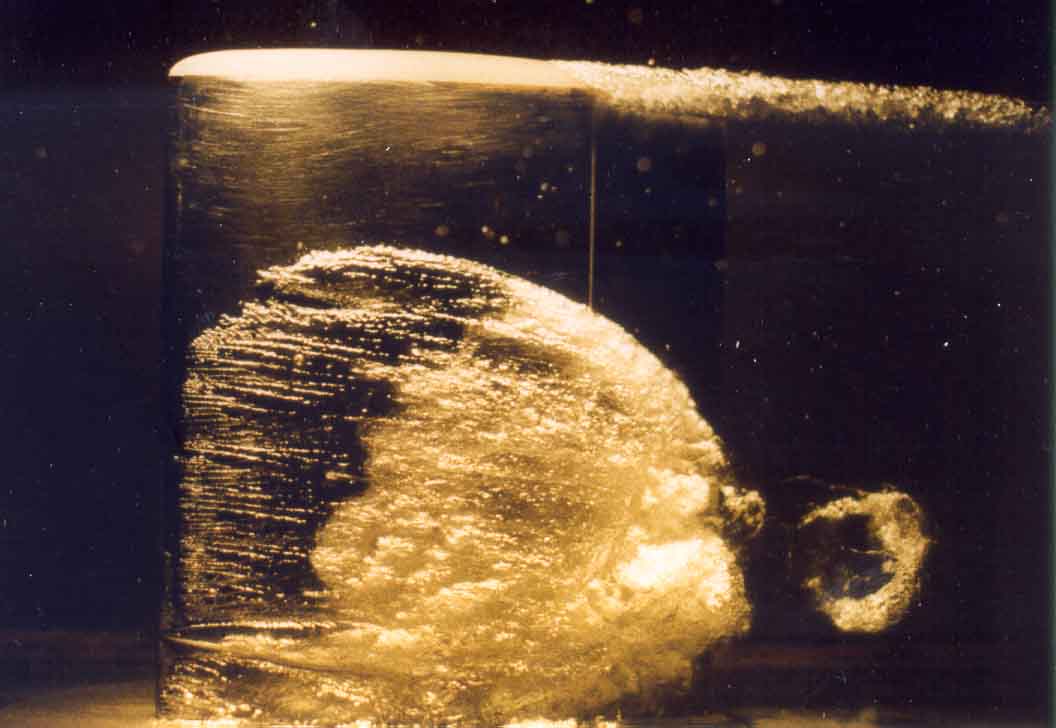
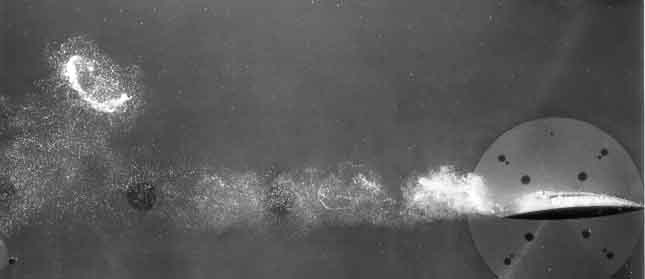
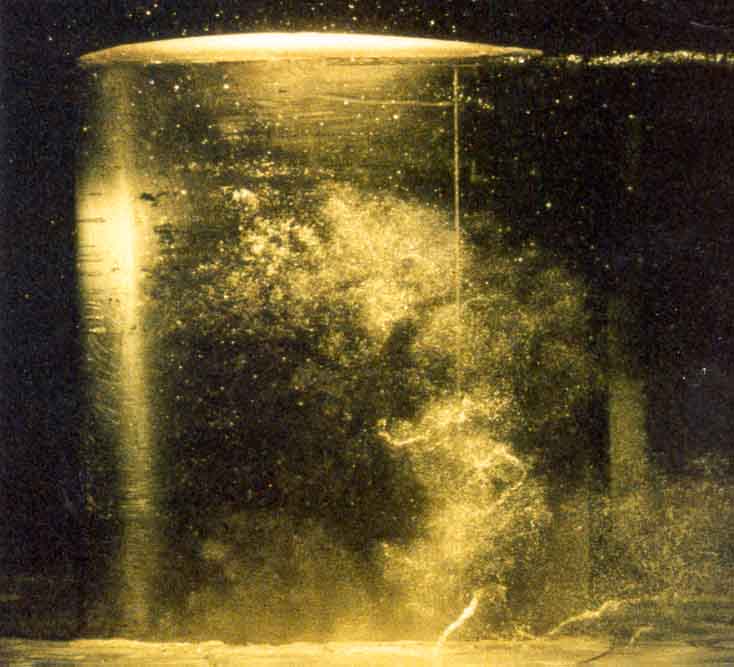
The three-dimensional shedding of vortices from a finite aspect ratio foil or other device can often lead to the formation and propagation of a ring vortex with a vapor/gas core. Figure 7.12 shows such a cavitating vortex ring that has just emerged from the closure region of an attached cavity on an oscillating foil. Often these ring vortices can persist for quite a distance as they are convected downstream. Another example is shown in Figure 7.13; in this case the vortex shedding is caused by the natural oscillations of a partially cavitating foil (see Section 7.9). The cavitating ring vortex has its own velocity of propagation relative to the surrounding fluid and has therefore moved substantially above the rest of the wake at the moment when the photograph was taken.
|
|
7.7 CLOUD CAVITATION
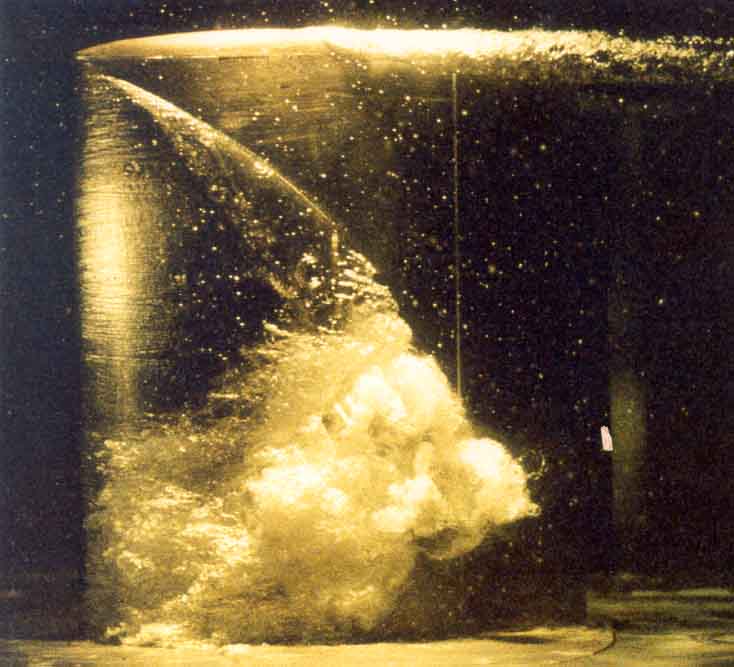
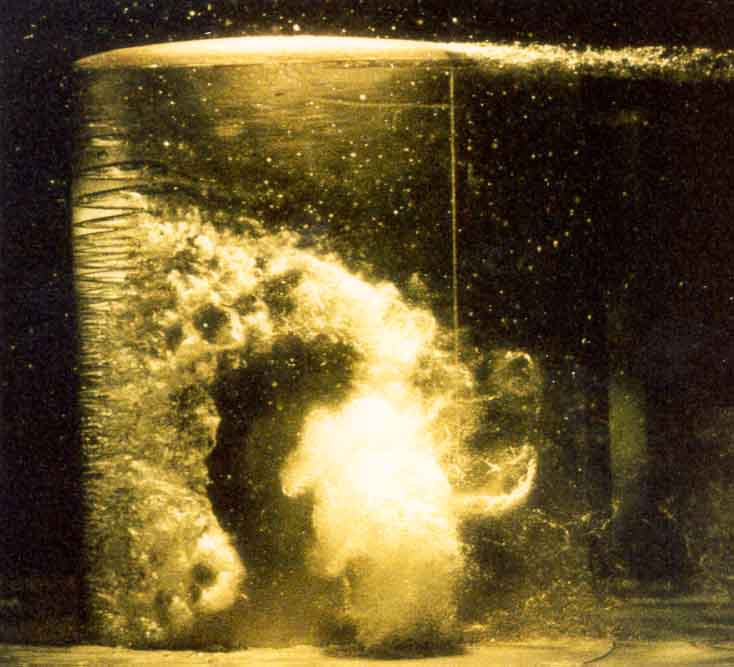
In many flows of practical interest one observes the periodic formation and collapse of a ``cloud'' of cavitation bubbles. Such a structure is termed ``cloud cavitation.'' The temporal periodicity may occur naturally as a result of the shedding of cavitating vortices (see, for example, Figure 7.11), or it may be the response to a periodic disturbance imposed on the flow. Common examples of imposed fluctuations are the interaction between rotor and stator blades in a pump or turbine and the interaction between a ship's propeller and the nonuniform wake created by the hull. In many of these cases the coherent collapse of the cloud of bubbles (see, for example, Figure 3.14) can cause more intense noise and more potential for damage than in a similar nonfluctuating flow (see Section 3.7). Bark and van Berlekom (1978), Shen and Peterson (1978), Franc and Michel (1988), Kubota et al. (1989), and Hart et al. (1990) have studied the complicated flow patterns involved in the production and collapse of a cavitating cloud on an oscillating hydrofoil. These studies are exemplified by the photographs of Figure 7.14, which show the formation, separation, and collapse of a cavitation cloud on a hydrofoil oscillating in pitch. All of these studies emphasize that a substantial bang occurs as a result of the collapse of the cloud; in Figure 7.14 this occurred between the middle and right-hand photographs.
| 
| 
|
Cloud cavitation continues to be a primary concern for propeller and pump manufacturers and is currently the subject of active research. In Chapter 6 we presented some simplified, analytical investigations that provided some qualitative information on the coherent dynamics of these structures. More accurate modeling of these complex, unsteady multiphase flows poses some challenging problems that have only begun to be addressed. The recent numerical modeling by Kubota, Kato, and Yamaguchi (1992) is an important step in this direction.
7.8 ATTACHED OR SHEET CAVITATION
Another class of large-scale cavitation structures is that which occurs when a wake or region of separated flow fills with vapor. Referring back to Figure 7.6, we note that Kermeen (1956) only observed dense traveling bubbles when the angle of attack was small. At angles of attack greater than about 10° (or less than about -2°) cavitation occurred as a single vapor-filled separation zone as illustrated in Figure 7.15. This form of cavitation on a hydrofoil or propeller blade is usually termed ``sheet'' cavitation; in the context of pumps it is known as ``blade'' cavitation.
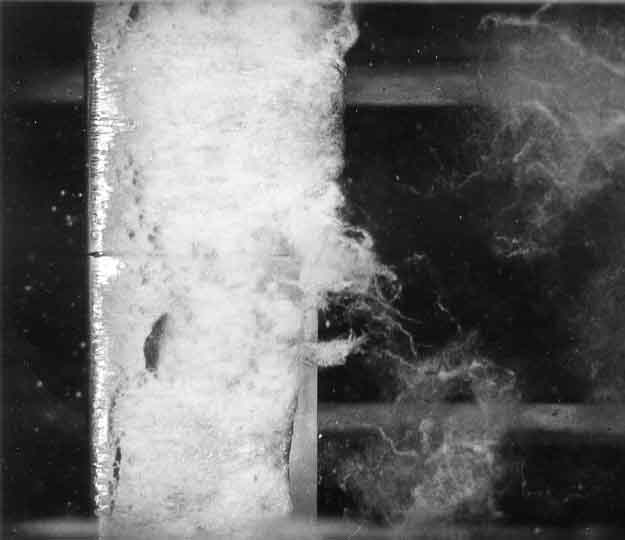
|
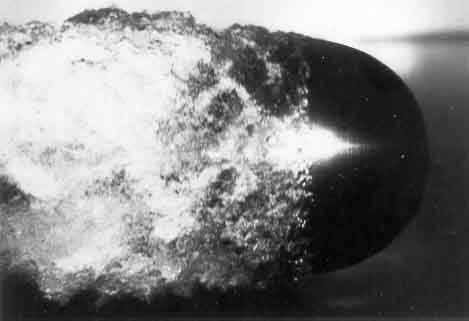
Bluff bodies often exhibit a sudden transition from traveling bubble cavitation to a single vapor-filled wake as the cavitation number is decreased. An example is shown in Figure 7.16 which includes two photographs of a cavitating sphere; the transition occurs when the bubbly wake in the picture on the left suddenly becomes a single vapor-filled void as seen in the picture on the right. In the context of bluff bodies, a vapor-filled wake is often called a ``fully developed'' or ``attached'' cavity. Clearly sheet, blade, fully developed, and attached cavities are terms for the same large-scale cavitation structure.
| 
|
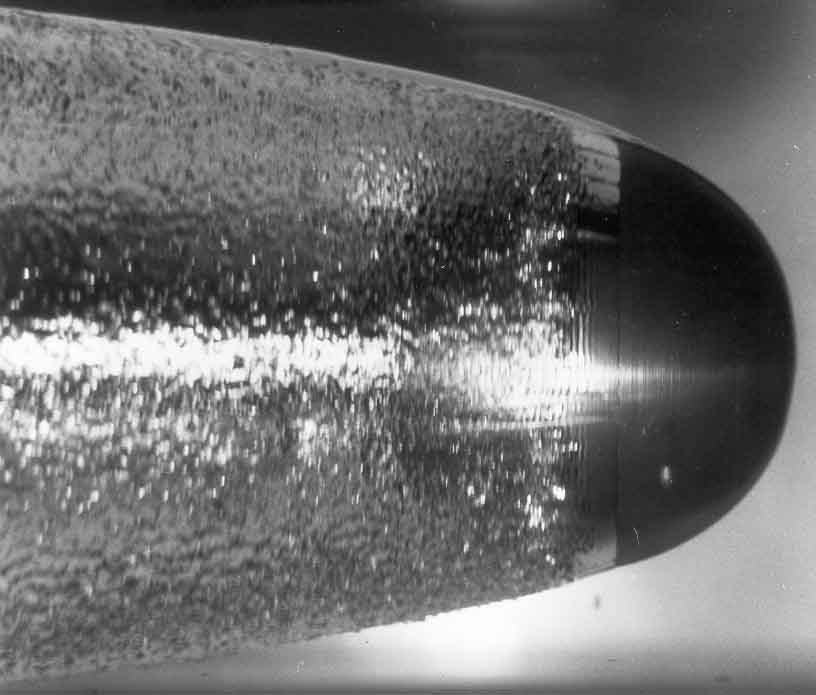
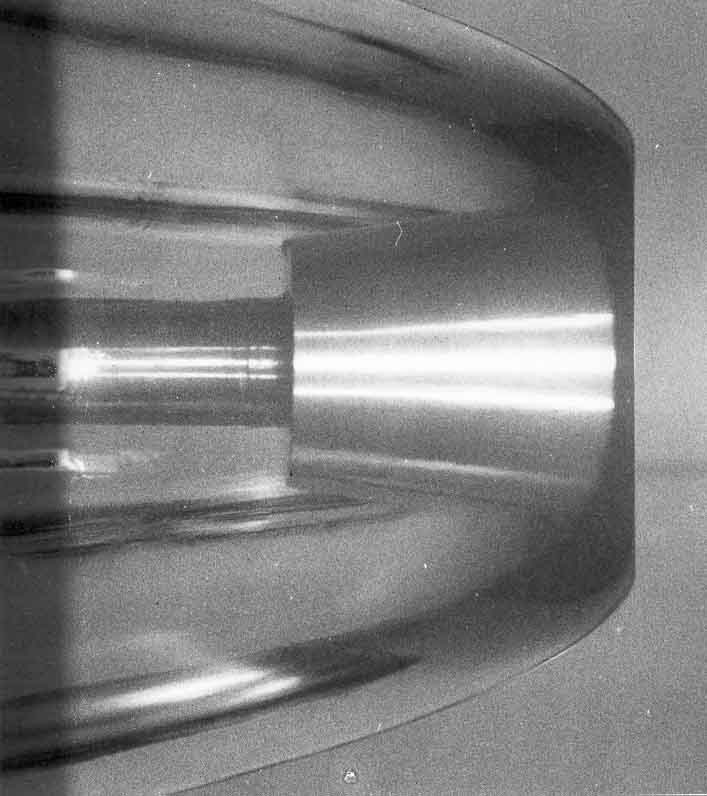
When a sharp edge provides a clean definition for the leading edge of a fully developed cavity, the surface of that cavity is often glassy smooth since the separating boundary layer is usually laminar. This initially smooth surface can be seen in the right-hand photograph of Figure 7.16 and in the photographs of Figure 7.17. Depending on the shape of the forebody the interfacial boundary layer may rapidly undergo transition to a turbulent interfacial layer, as is the case in the photograph of the cavitating ogive in Figure 7.17 and the cavitating sphere in the photograph on the right of Figure 7.16. For other headforms transition may be delayed almost indefinitely, as in the case of the cavitating disc of Figure 7.17 (see Brennen 1970).
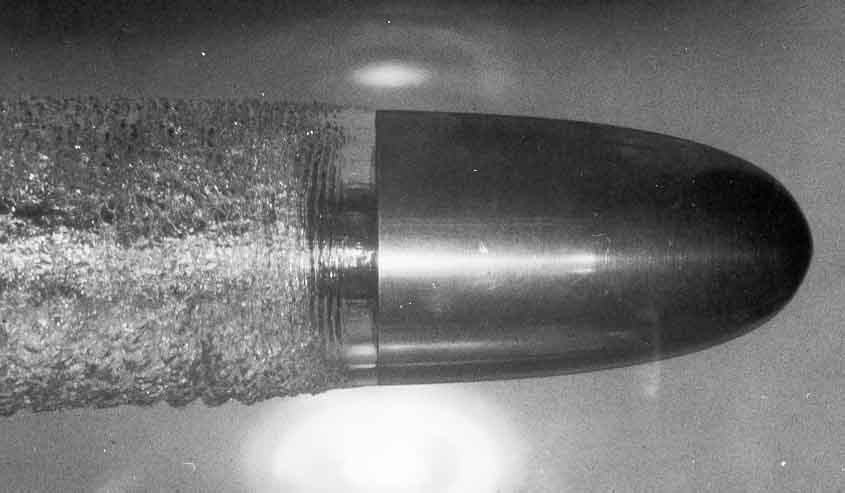
| 
|
When there is no sharp edge to initiate a fully developed cavity, several different phenomena may occur. Cavitation separation may still occur along a well-defined and stable line on the body surface, as exemplified by the photograph on the right in Figure 7.16. Or the separation line may be interrupted, as in the photograph of Figure 7.18. For example, such a scalloped leading edge is typical of cavitation in bearings (Dowson and Taylor 1979).
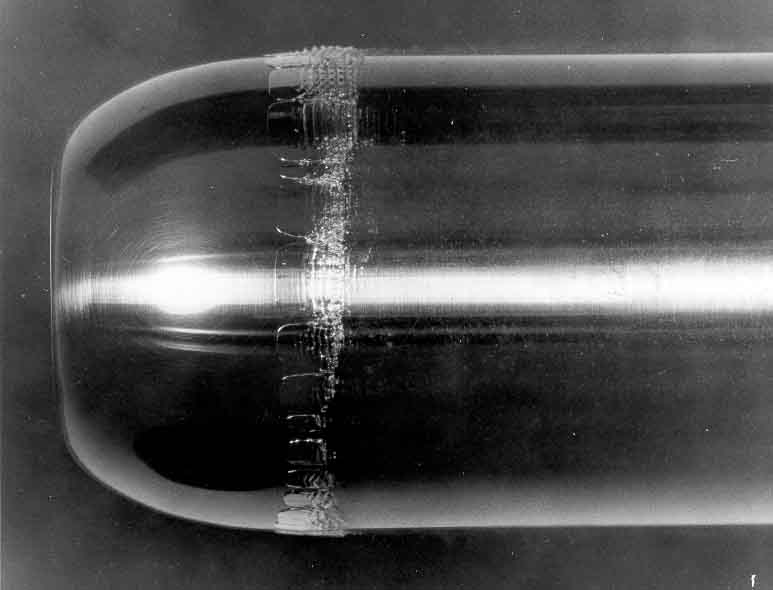
|
Other forms of developed cavitation can be strikingly different from that of Figures 7.17 or 7.18. Sometimes the cavities occur as streaks, as exemplified by the photograph in Figure 7.19 of cavitation on the surface of a biconvex hydrofoil (Arakeri 1975). Again a tranverse periodicity appears to occur in which one can envisage that the expansion of the flow in the streamtubes containing cavities results in an increase in the pressure in the fluid in between these cavitating streamtubes and therefore inhibits further lateral spreading of the cavitation. Currently there does not appear to be any clear understanding of the reason for the transverse periodicity of Figures 7.18 and 7.19.
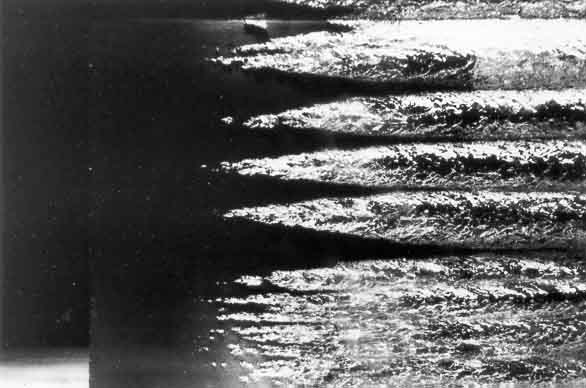
|
7.9 CAVITATING FOILS
On a lifting foil (a hydrofoil), attached cavitation can take a number of forms, as discussed in the review by Acosta (1973). When, as sketched in Figure 7.20, the attached cavity closes on the suction surface of the foil, the condition is referred to as ``partial cavitation.'' This is the form of attached cavitation most commonly observed on propellers and in pumps. At lower cavitation numbers, the cavity may close well downstream of the trailing edge of the foil, as shown in the lower sketch in Figure 7.20. Such a configuration is termed ``super-cavitation'' and propellers for high-speed boats are often designed to be operated under these conditions. In between these regimes, experiments have shown (Wade and Acosta 1966) that, when the length of the cavity is close to the length of the foil (between about 3/4 and 4/3 times the chord), the flow becomes unstable and the size of the cavity fluctuates quite violently between these limits. During this fluctuation cycle, the cavity lengthens fairly smoothly. On the other hand, it shortens by a process of ``pinching-off'' of a large cloud of bubbles from the rear of the cavity, and this cloud can collapse quite violently as described previously. However, there is also shed vorticity bound up in the cloud, and this is concentrated by the collapse of the cloud. One result is the formation of the vortex ring seen in Figure 7.13. In pumps and other devices, this condition between partial and supercavitation clearly needs to be avoided because of the potential damage that can result. Further discussion of this oscillating cavity phenomenon is included in Section 8.8. It should also be noted that cavities may fluctuate for other reasons, as discussed in the next section.
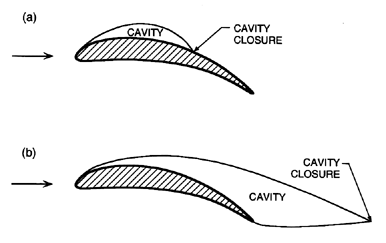
| Figure 7.20 Sketch of the types of attached cavitation on a lifting foil: (a) partial cavitation (b) supercavitation. |
Methods for the analysis of both partially and supercavitating flows are discussed in the next chapter.
7.10 CAVITY CLOSURE
The flow in the vicinity of cavity closure deserves further comment because it is quite complex and involves processes that have not, as yet, been discussed. First, the flow is invariably turbulent since the boundary layer, which detaches from the body along with the free surface, produces an interfacial boundary layer. This is almost always unstable and undergoes transition to yield a turbulent interfacial layer (Brennen 1970). The level of turbulence in this layer grows rapidly as the closure region is approached, so the flow in that vicinity usually appears as a frothy turbulent mixing motion. Where the two free surface streams collide, some flow is deflected back into the cavity. Observations of this ``reentrant jet'' were part of the motivation for the reentrant jet model of cavity closure, which is sometimes employed in potential flow solutions (see Section 8.2). However, actual reentrant jets are nothing like as coherent as the jet in that model; they could better be described as a frothy turbulent mass tumbling back into the cavity.
Changes to the structure of the flow in the closure region can occur in horizontal flows when the buoyancy forces become significant. Such will be the case when the Froude number based on cavity length, ℓ, Fr=U∞/(gℓ)½, is less than some critical value denoted by Frc. For bodies of small aspect ratio (such as axisymmetric headforms) it appears that Frc≈2.5 (Brennen 1969) and, when Fr<Frc, the reentrant jet structure no longer occurs. Instead, a pair of counter-rotating vortices with gas/vapor cores form in the closure region (Cox and Claydon 1956); this type of closure is much steadier and less turbulent than the reentrant jet type, which is prevalent at higher Froude numbers. The rate at which vapor/gas can be entrained by the counter-rotating vortex closure is much higher than for the reentrant jet closure (Brennen 1969).
Returning to our discussion of the reentrant jet form of cavity closure, we note that this flow can also exhibit significant fluctuations. These fluctuations can be caused by vortex shedding from the rear of the cavity (Young and Holl 1966); they may also be the result of some other, less well understood instability associated with this complex multiphase flow. Knapp (1955) first described the cyclic process in which a ``pinching off'' mechanism (similar to that described in the last section) produces vortices that initially have large, bubbly vapor/gas cores (see also Furness and Hutton 1975). As the vapor condenses and the core of the cloud/vortex collapses, the vorticity is concentrated and the vortices become more intense before they enter the normal, single-phase wake flow. After condensation, only small, remnant gas bubbles containing the residual noncondensable component remain to be convected away into the far wake. It is, incidentally, this supply of microbubbles to the tunnel population that neccessitates the use of a resorber in a cavitation tunnel (see Section 1.15).
It should also be noted that under some circumstances this cyclic process in the cavity closure region is more evident than in others. Moreover, there are several other instabilities that can trigger or promote such a cyclic shedding process. We have already discussed one such instability in the preceding section, the partial cavitation instability. A somewhat similar cavity pulsation phenomenon occurs when large super-cavities are created by supplying noncondensable gas to the wake of a body. Such cavities, which are visually almost indistinguishable from their natural or vapor-filled counterparts, are known as ``ventilated'' cavities. However, when the gas supplied is increased to the point at which the entrainment processes in the closure region (see below) are unable to carry away that volume of gas, the cavity may begin to fluctuate; a pinching-off process sheds a large gas volume into the wake, and this is followed by regrowth of the cavity. This phenomenon was investigated by Silberman and Song (1961) and Song (1962). Finally, we should mention one other process that may be at work in the closure region. In the case of predominantly vapor-filled cavities Jakobsen (1964) has suggested that a condensation shock provides a mechanism for cavity closure (simple shocks of this kind were analysed in Section 6.9). This last suggestion deserves more study than it has received to date.
Both the large-scale fluctuations and the small-scale turbulence in the closure region act to entrain bubbles and thus remove vapor/gas from the cavity, though it is clear from the preceding paragraphs that the precise mechanisms of entrainment may differ considerably from one closure configuration to another. Measurements of the volume rate of entrainment for large cavities with the steady, reentrant jet type of closure (for example, Brennen 1969) suggest that the volume rate increases with velocity as U∞n where n is a little larger than unity. Using axisymmetric headforms of different size, b, Billet and Weir (1975) showed that though the volume entrainment rate scaled approximately with U∞b2, there was a significant variation with cavitation number, σ, the volume rate increasing substantially as σ decreased and the cavity became larger.
Under steady-state conditions, the removal of vapor and noncondensable gas by entrainment in the closure region is balanced by the supply process of evaporation and the release of gas from solution along the length of the free surface. These supply processes will, in turn, be affected by the state of the interfacial boundary layer. A turbulent layer will clearly enhance the heat and mass diffusion processes that produce evaporation and the release of gas from solution. One of the consequences of the balance between the supply of noncondensable gas (air) and its removal by entrainment is the inherent regulation of the partial pressure of the noncondensable gas (air) in the cavity. Brennen (1969) put together a simplified model of these processes and showed that the results for the partial pressure of air were in rough agreement with experimental measurements of that partial pressure. Moreover, there is an analogous balance of heat in which the latent heat removed by the entrainment process must be balanced by the heat diffused to the cavity through the interfacial layer. This requires a cavity temperature below that of the surrounding liquid. (This thermal effect in fully developed cavity flows is analogous to the thermal effect in the dynamics of individual bubbles described in Sections 2.3 and 2.7.) The temperature depression produced by this process has been investigated by a number of authors including Holl, Billet, and Weir (1975). Though it is usually small in water at normal temperatures, it can be significant at higher temperatures or in other liquids at temperatures similar to those at which single bubbles experience significant thermal effects on growth (see Section 2.7).
- Acosta, A.J. (1973). Hydrofoils and hydrofoil craft. Ann. Rev. Fluid Mech., 5, 161--184.
- Arakeri, V.H. and Acosta, A.J. (1973). Viscous effects in the inception of cavitation on axisymmetric bodies. ASME J. Fluids Eng., 95, 519--528.
- Arakeri, V.H. (1975). Viscous effects on the position of cavitation separation from smooth bodies. J. Fluid Mech., 68, 779--799.
- Arakeri, V.H. (1979). Cavitation inception. Proc. Indian Acad. Sci., C2, Pt. 2, 149--177.
- Arakeri, V.H. and Shanmuganathan, V. (1985). On the evidence for the effect of bubble interference on cavitation noise. J. Fluid Mech., 159, 131--150.
- Bark, G. and van Berlekom, W.B. (1978). Experimental investigations of cavitation noise. Proc. 12th ONR Symp. on Naval Hydrodynamics, 470--493.
- Bernal, L.P. and Roshko, A. (1986). Streamwise vortex structure in plane mixing layers. J. Fluid Mech., 170, 499--525.
- Billet, M.L. and Weir, D.S. (1975). The effect of gas diffusion on the flow coefficient for a ventilated cavity. Proc. ASME Symp. on Cavity Flows, 95--100.
- Birkhoff, G. and Zarantonello, E.H. (1957). Jets, wakes and cavities. Academic Press.
- Blake, W. K., Wolpert, M. J., and Geib, F. E. (1977). Cavitation noise and inception as influenced by boundary-layer development on a hydrofoil. J. Fluid Mech., 80, 617--640.
- Braisted, D.M. (1979). Cavitation induced instabilities associated with turbomachines. Ph.D. Thesis, Calif. Inst. of Tech.
- Brennen, C. (1969). The dynamic balances of dissolved air and heat in natural cavity flows. J. Fluid Mech., 37, 115--127.
- Brennen, C. (1970). Cavity surface wave patterns and general appearance. J. Fluid Mech., 44, 33--49.
- Briançon-Marjollet, L., Franc, J.P., and Michel, J.M. (1990). Transient bubbles interacting with an attached cavity and the boundary layer. J. Fluid Mech., 218, 355--376.
- Ceccio, S. L. and Brennen, C. E. (1991). Observations of the dynamics and acoustics of travelling bubble cavitation. J. Fluid Mech., 233, 633--660.
- Cox, R.N. and Claydon, W.A. (1956). Air entrainment at the rear of a steady cavity. Proc. Symp. on Cavitation in Hydrodynamics, N.P.L., London.
- Dowson, D. and Taylor, C.M. (1979). Cavitation in bearings. Ann. Rev. of Fluid Mech., 11, 35--66.
- Ellis, A.T. (1952). Observations on bubble collapse. Calif. Inst. of Tech. Hydro. Lab. Rep. 21-12.
- Franc, J.P. and Michel, J.M. (1988). Unsteady attached cavitation on an oscillating hydrofoil. J. Fluid Mech., 193, 171--189.
- Furness, R.A. and Hutton, S.P. (1975). Experimental and theoretical studies on two-dimensional fixed-type cavities. Proc. ASME Symp. on Cavity Flows, 111--117.
- Hart, D.P., Brennen, C.E., and Acosta, A.J. (1990). Observations of cavitation on a three-dimensional oscillating hydrofoil. ASME Cavitation and Multiphase Flow Forum, FED 98, 49-52.
- Higuchi, H., Rogers, M.F., and Arndt, R.E.A. (1986). Characteristics of tip cavitation noise. Proc. ASME Int. Symp. on Cavitation and Multiphase Flow Noise, FED 45, 101--106.
- Holl, J.W. (1969). Limited cavitation. In Cavitation State of Knowledge (eds: J.M. Robertson and G.F. Wislicenus), ASME, New York.
- Holl, J.W. and Kornhauser, A.L. (1970). Thermodynamic effects on desinent cavitation on hemispherical nosed bodies in water at temperatures from 80°F to 260°F. ASME J. Basic Eng., 92, 44--58.
- Holl, J.W., Billet, M.L., and Weir, D.S. (1975). Thermodynamic effects on developed cavitation. Proc. ASME Symp. on Cavity Flows, 101--109.
- Holl, J.W. and Carroll, J.A. (1979). Observations of the various types of limited cavitation on axisymmetric bodies. Proc. ASME Int. Symp. on Cavitation Inception, 87--99.
- Huang, T.T. (1979). Cavitation inception observations on six axisymmetric headforms. Proc. ASME Int. Symp. on Cavitation Inception, 51--61.
- Jakobsen, J.K. (1964). On the mechanism of head breakdown in cavitating inducers. ASME J. Basic Eng., 86, 291--304.
- Johnson, V.E., Jr. and Hsieh, T. (1966). The influence of the trajectories of gas nuclei on cavitation inception. Proc. 6th ONR Symp. on Naval Hydrodynamics, 163--182.
- Katz, J. and O'Hern, T.J. (1986). Cavitation in large scale shear flows. ASME J. Fluids Eng., 108, 373--376.
- Kermeen, R.W. (1956). Water tunnel tests of NACA 4412 and Walchner Profile 7 hydrofoils in non-cavitating and cavitating flows. Calif. Inst. of Tech. Hydro. Lab. Rep. 47-5.
- Kermeen, R.W., McGraw, J.T., and Parkin, B.R. (1955). Mechanism of cavitation inception and the related scale-effects problem. Trans. ASME, 77, 533--541.
- Kirchhoff, G. (1869). Zur Theorie freier Fl&uulm;ssigkeitsstrahlen. Z. reine Angew. Math., 70, 289--298.
- Knapp, R.T. and Hollander, A. (1948). Laboratory investigations of the mechanism of cavitation. Trans. ASME, 70, 419--435.
- Knapp, R.T. (1955). Recent investigations of the mechanics of cavitation and cavitation damage. Trans. ASME, 77, 1045--1054.
- Kubota, A., Kato, H., Yamaguchi, H., and Maeda, M. (1989). Unsteady structure measurement of cloud cavitation on a foil section using conditional sampling. ASME J. Fluids Eng., 111, 204--210.
- Kubota, A., Kato, H., and Yamaguchi, H. (1992). A new modelling of cavitating flows---a numerical study of unsteady cavitation on a hydrofoil section. J. Fluid Mech., 240, 59--96.
- Kuhn de Chizelle, Y., Ceccio, S.L., Brennen, C.E., and Gowing, S. (1992). Scaling experiments on the dynamics and acoustics of travelling bubble cavitation. Proc. 3rd I. Mech. E. Int. Conf. on Cavitation, Cambridge, England, 165--170.
- Kuhn de Chizelle, Y., Ceccio, S.L., Brennen, C.E., and Shen, Y. (1992). Cavitation scaling experiments with headforms: bubble acoustics. Proc. 19th ONR Symp. on Naval Hydrodynamics, 72--84.
- Kumar, S. and Brennen, C.E. (1993). A study of pressure pulses generated by travelling bubble cavitation. J. Fluid Mech., 255, 541--564.
- Lindgren, H. and Johnsson, C.A. (1966). Cavitation inception on headforms, ITTC comparative experiments. Proc. 11th Int. Towing Tank Conf., Tokyo, 219-232.
- Marboe, R.C., Billet, M.L., and Thompson, D.E. (1986). Some aspects of travelling bubble cavitation and noise. Proc. ASME Int. Symp. on Cavitation and Multiphase Flow Noise, FED 45, 119-126.
- Oshima, R. (1961). Theory of scale effects on cavitation inception on axially symmetric bodies. ASME J. Basic Eng., 83, 379--398.
- Parkin, B.R. (1952). Scale effects in cavitating flow. Ph.D. Thesis, Calif. Inst. of Tech.
- Plesset, M.S. (1948). The dynamics of cavitation bubbles. ASME J. Appl. Mech., 16, 228--231.
- Schiebe, F.R. (1972). Measurements of the cavitation susceptibility using standard bodies. St. Anthony Falls Hydr. Lab., Univ. of Minnesota, Rep. No. 118.
- Shen, Y. and Peterson, F.B. (1978). Unsteady cavitation on an oscillating hydrofoil. Proc. 12th ONR Symp. on Naval Hydrodynamics, 362--384.
- Silberman, E. and Song, C.S. (1961). Instability of ventilated cavities. J. Ship Res., 5, 13--33.
- Song, C.S. (1962). Pulsation of ventilated cavities. J. Ship Res., 5, 8--20.
- Titchmarsh, E.C. (1947). The theory of functions. Oxford Univ. Press.
- van der Meulen, J.H.J. and van Renesse, R.L. (1989). The collapse of bubbles in a flow near a boundary. Proc. 17th ONR Symp. on Naval Hydrodynamics, 379--392.
- Van der Walle, F. (1962). On the growth of nuclei and the related scaling factors in cavitation inception. Proc. 4th ONR Symp. on Naval Hydrodynamics, 357--404.
- Van Tuyl, A. (1950). On the axially symmetric flow around a new family of half-bodies. Quart. Appl. Math., 7, 399--409.
- Wade, R.B. and Acosta, A.J. (1966). Experimental observations on the flow past a plano-convex hydrofoil. ASME J. Basic Eng., 88, 273--283.
- Weinstein, A. (1948). On axially symmetric flow. Quart. Appl. Math., 5, 429--444.
- Young, J.O. and Holl, J.W. (1966). Effects of cavitation on periodic wakes behind symmetric wedges. ASME J. Basic Eng., 88, 163--176.
Last updated 12/1/00.
Christopher E. Brennen